6: Running from the Command-Line#
Introduction#
So far, we have run the calculations through SEAMM, either by submitting the job from the SEAMM GUI or by resubmitting a job from the Dashboard with potantially different parameters. However, you can directly run a flowchart in a terminal as long as you have SEAMM installed on the machine. In this tutorial we are going to see how to do that.
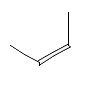
We are going to use the flowchart from tutorial 5, 5: Looping Over Structures and run a similar calculation. Running the alcohols and thiols is getting a bit boring, so let’s look at a bit more interesting set of systems, the isomers of C4H8. There are at least six experimentally known isomers:
|
|
|
|
|
|
The enthalpy of formation for these isomers are known so they give us a nice opportunity to compare various methods against experiment. The cyclic structures are highly strained and a bit unusual, so are a nice test of methods, as are the more subtle differences in the placement of the methyl group between 2-methylprop-1-ene and but-1-ene, and the cis-trans isomerization of (Z)-but-2-ene and (E)-but-2-ene.
Tutorials for other methods will use these systems too, so if you use other codes in SEAMM you will find out how they handle these systems.
Getting the Flowchart#
You need to get the flowchart and save it to your local machine. Make a temporary directory or folder to run in, something like ~/tmp. There are three ways to get the flowchart into this directory:
If you still have the flowchart in the SEAMM GUI, or read it from the Dashboard or Zenodo, you can save it to disk using the File menu and Save as….
You can download it from the example Job 314 on the public MolSSI server by right-clicking on flowchart.flow in the list of files in the left pane and selecting Download as… or the similar phrase in your browser.
You can download it from Zenodo (the link will open in a new tab) by clicking on the
Downloadbutton and then moving the file to your temporary directory.
Running the Flowchart#
Now open a terminal or command window and go to the temporary directory that you made. Activate the seamm conda environment:
conda activate seamm
Now execute the flowchart:
run_flowchart flowchart.flow "C=C(C)C" "C/C=C/C" "C/C=C\\C" C=CCC C1CC1C C1CCC1
Note
The arguments are the SMILES for the structures from the table above. A couple of comments: it may be necessay to quote some of the strings (it is safe to quote them all) and, on Linux, the backslash (\) is special and needs to doubled to show up as a single backslash.
You should see output appear in the terminal:
Running in standalone mode.
Monday 2023.11.13 13:17:33
Running in directory '/Users/psaxe/tmp3'

Description of the flowchart
----------------------------
Step 0: Start  2023.11.7+6.g13a9542.dirty
Step 1: Parameters  2023.11.6
      The following variables will be set from command-line arguments, or if
      not present, to the default value.

      +------------+--------+-----------+-------------------------------------+
      | Variable   | Type   | Default   | Description                         |
      +============+========+===========+=====================================+
      | structures | str    |           | The structures as SMILES, InChI, or |
      |            |        |           | InChIKeys                           |
      +------------+--------+-----------+-------------------------------------+
...
             Structure  total energy (E_h)  energy of formation (kJ/mol)
    2-methylprop-1-ene           -9.852264                     -6.396972
         (E)-but-2-ene           -9.853112                     -8.621124
         (Z)-but-2-ene           -9.851636                     -4.746395
             but-1-ene           -9.847232                      6.816176
    methylcyclopropane           -9.839414                     27.342422
           cyclobutane           -9.847296                      6.646899
...
(4) Eliseo Marin-Rimoldi; Paul Saxe. Read Structure plug-in for SEAMM for
    reading chemical structure files, version 2023.11.5; The Molecular Sciences
    Software Institute (MolSSI): Virginia Tech, Blacksburg, VA, USA,
    https://github.com/molssi-seamm/from_smiles_step

Process time: 0:00:12.194969 (12.195 s)
Elapsed time: 0:00:22.703322 (22.703 s)
Monday 2023.11.13 13:17:58
And if you list the files in the directory you will see the same set of files as in the Dashboard when you ran previously:
ls -l
total 1024
drwxr-xr-x  2 psaxe  staff      64 Nov 13 13:17 0
drwxr-xr-x  3 psaxe  staff      96 Nov 13 13:17 1
drwxr-xr-x  3 psaxe  staff      96 Nov 13 13:17 2
drwxr-xr-x  2 psaxe  staff      64 Nov 13 13:17 3
drwxr-xr-x  8 psaxe  staff     256 Nov 13 13:17 4
drwxr-xr-x  3 psaxe  staff      96 Nov 13 13:17 5
drwxr-xr-x  3 psaxe  staff      96 Nov 13 13:17 6
-rw-r--r--  1 psaxe  staff    1488 Nov 13 13:17 final_structure.mmcif
-rwxr-xr--  1 psaxe  staff   44854 Nov 13 13:16 flowchart.flow
-rw-r--r--  1 psaxe  staff   10492 Nov 13 13:17 job.out
-rw-r--r--  1 psaxe  staff    3819 Nov 13 13:17 job_data.json
-rw-r--r--  1 psaxe  staff   90112 Nov 13 13:17 references.db
-rw-r--r--  1 psaxe  staff  307200 Nov 13 13:17 seamm.db
-rw-r--r--  1 psaxe  staff   16122 Nov 13 13:17 structures.sdf
-rw-r--r--  1 psaxe  staff     366 Nov 13 13:17 table1.csv
Indeed, everything is just like it was in Dashboard, so hopefully is familiar by now.
Results#
As mentioned in the introduction, the experimental enthalpies of formation are available for these structures, so let’s see how our calculations using DFTB+ did. Remember that DFTB+ is calculating electronic energies of formation, which is the main term in the enthalpy of formation, but there are other terms missing, so we are comparing somewhat different things. Also, DFTB is a fast, semiempirical method so we don’t expect it to be very accurate.
Arguments to the Flowchart#
If you run the flowchart and add –help at the end of the command, it will print help text and stop without actually running:
(seamm-dev) psaxe@PaulsPersonal tmp3 % run_flowchart flowchart.flow --help
run_flowchart flowchart.flow --help
usage: flowchart.flow [-h] [--root ROOT] [--datastore DATASTORE] [--job-id-file JOB_ID_FILE] [--dashboards DASHBOARDS]
                      [--log-level {NOTSET,DEBUG,INFO,WARNING,ERROR,CRITICAL}] [--database DATABASE] [--read-only] [--standalone] [--project PROJECTS]
                      [--title TITLE] [--description DESCRIPTION] [--force] [--parallelism {none,mpi,openmp,any}] [--ncores NCORES] [--memory MEMORY]
                      structures [structures ...] start-node-step control-parameters-step table-step join-node-step loop-step from-smiles-step
                      dftbplus-step read-structure-step

positional arguments:
  structures            The structures as SMILES, InChI, or InChIKeys

optional arguments:
  -h, --help            show this help message and exit

main options:
  The main options for SEAMM

  --root ROOT           The root directory for SEAMM data, default: ~/SEAMM
  --datastore DATASTORE
                        The datastore (directory) for this run, default: ${root}/Jobs
  --job-id-file JOB_ID_FILE
                        The job_id file to use.
  --dashboards DASHBOARDS
                        The configuration file for accessible dashboards: ${root}/dashboards.ini

debugging options:
  Options for turning on debugging output and tools

  --log-level {NOTSET,DEBUG,INFO,WARNING,ERROR,CRITICAL}
                        The level of informational output, default: 'WARNING'

job options:
  Options for jobs

  --database DATABASE   The database for this job.
  --read-only           Whether to open the database as read-only.
  --standalone          Run this workflow as-is without using the job, etc.
  --project PROJECTS    The project(s) for this job.
  --title TITLE         The title for this run.
  --description DESCRIPTION
                        The longer description for this run.
  --force               Overwrite the job output if it exists.

hardware options:
  Options about memory limits, parallelism and other details connected with hardware.

  --parallelism {none,mpi,openmp,any}
                        Whether to limit parallel usage to certain types.
  --ncores NCORES       The maximum number of cores/threads to use in any step. Default: all available cores.
  --memory MEMORY       The maximum amount of memory to use in any step, which can be 'all' or 'available', or a number, which may use k, Ki, M, Mi, etc.
                        suffixes. Default: available.

plug-ins:
  The plug-ins in this flowchart, which have their own options.

  start-node-step
  control-parameters-step
  table-step
  join-node-step
  loop-step
  from-smiles-step
  dftbplus-step
  read-structure-step
There a lot of options! However you can ignore most of them because they are for special circumstances. Note that there are a number of options controlling parallelsim, which might be of interest as you get further into SEAMM.
The interesting options are the positional and optional options:
positional arguments:
  structures            The structures as SMILES, InChI, or InChIKeys

optional arguments:
  -h, --help            show this help message and exit
Apart from –help these are the options defined in the Parameters steps in the
flowcharts, i.e. the ones that you should think about when running the flowchart. We had
only had one option, structures. Notice that the description that we put into the
flowchart is printed here, too, to help the user.
A final comment. At the end of the help text it lists all the steps in flowcharts. Each of these have their own parameters, which focus on detailed control of the executables, etc., on debugging and on parallelism. You can access this help by putting the name of the step followed by –help:
(seamm-dev) psaxe@PaulsPersonal tmp3 % run_flowchart flowchart.flow dftbplus-step --help
usage: flowchart.flow [-h] [--log-level {NOTSET,DEBUG,INFO,WARNING,ERROR,CRITICAL}] [--dftbplus-path DFTBPLUS_PATH] [--slako-dir SLAKO_DIR]
                      [--use-mpi USE_MPI] [--use-openmp USE_OPENMP] [--natoms-per-core NATOMS_PER_CORE] [--max-atoms-to-print MAX_ATOMS_TO_PRINT] [--html]

optional arguments:
  -h, --help            show this help message and exit
  --dftbplus-path DFTBPLUS_PATH
                        the path to the DFTB+ executable
  --slako-dir SLAKO_DIR
                        the path to the Slater-Koster parameter files
  --use-mpi USE_MPI     Whether to use mpi
  --use-openmp USE_OPENMP
                        Whether to use openmp threads
  --natoms-per-core NATOMS_PER_CORE
                        How many atoms to have per core or thread
  --max-atoms-to-print MAX_ATOMS_TO_PRINT
                        Maximum number of atoms to print charges, etc.
  --html                whether to write out html files for graphs, etc.

debugging options:
  Options for turning on debugging output and tools

  --log-level {NOTSET,DEBUG,INFO,WARNING,ERROR,CRITICAL}
                        The level of informational output, defaults to 'WARNING'
You’ll probably never need this level of control, but it is nice to know that it is there. And if you are a developer, you can see that you can override the path to the executable and other specific information for the code as you develop.
Adding to the Dashboard#
One final thing. There are three options that you can use to run the job in the Dashboard, rather than just locally. These options are:
- --projects
A list of one or more projects for the job. If this is present the job is run in the Dashboard.
- --title
The title for the job. No more than 100 characters. You’ll need to quote this is it contains blanks, etc.
- --description
A longer description for the job. You’ll almost certainly need to quote this!
Let’s give this a go! Delete all the files except the flowchart in your temporary job and run again, like this:
(seamm) psaxe@molssi10:~/tmp$ ./flowchart.flow --project default --title "C4H8 isomers DFTB/3ob" \
>              --description "Running the C4H8 isomers with DFTB+ from the commandline" \
>              "C=C(C)C" "C/C=C/C" "C/C=C\\C" C=CCC C1CC1C C1CCC1
Monday 2023.11.13 17:36:30
Running in directory '/home/psaxe/SEAMM/Jobs/projects/default/Job_000315'

Description of the flowchart
----------------------------
Step 0: Start  2023.11.11
...
The command line is quite long, so I typed it on several lines for clarity. You can just put it in one lone line, or use the backslash character (on Linux and Mac) to continue the line, like I did.
Note
The example above does not use run_flowchart. If the flowchart is executable, you
can execute it directly. When you save from SEAMM, the flowcharts are executable.
You will see the normal output scroll past on the screen; however, note that the job is actually running in a different directory, /home/psaxe/SEAMM/Jobs/projects/default/Job_000315 in the example above. There will be no files in the driectory that you are running from – they are all in the Dashboard instead. You can look at the job in the Dashboard, just as if you had submitted the job to the Dashboard.
Why would you want to do this? One reason is it let’s you control the jobs on the machine. For instance, if you install SEAMM on a cluster or other large machine, you can submit jobs to the queueing system but have them added to the Dashboard. The Dashboard doesn’t have to be running for this. Often you can’t leave the Dashboard running at large computer centers, but you can run this way, and later log on to the machine, run the Dashboard manually, and look at the results like normal. Look for more information of how to do this in the How-To Guide.


