

5: Looping Over Structures#
Note
The flowchart for this tutorial is available at Zenodo and also can be directly loaded into SEAMM by opening from Zenodo.
Introduction#
In the previous tutorials we have slowly built up easier and easier ways to run a calculation on a molecule that we define using SMILES. We’ve used DFTB+ to run the calculations because it is available and fast; however, we could replace it with any code that can optimize structures – at the moment LAMMPS, MOPAC, Psi4, Gaussian, and FHI-aims are available in SEAMM, and any of them would work.
Creating the Flowchart#
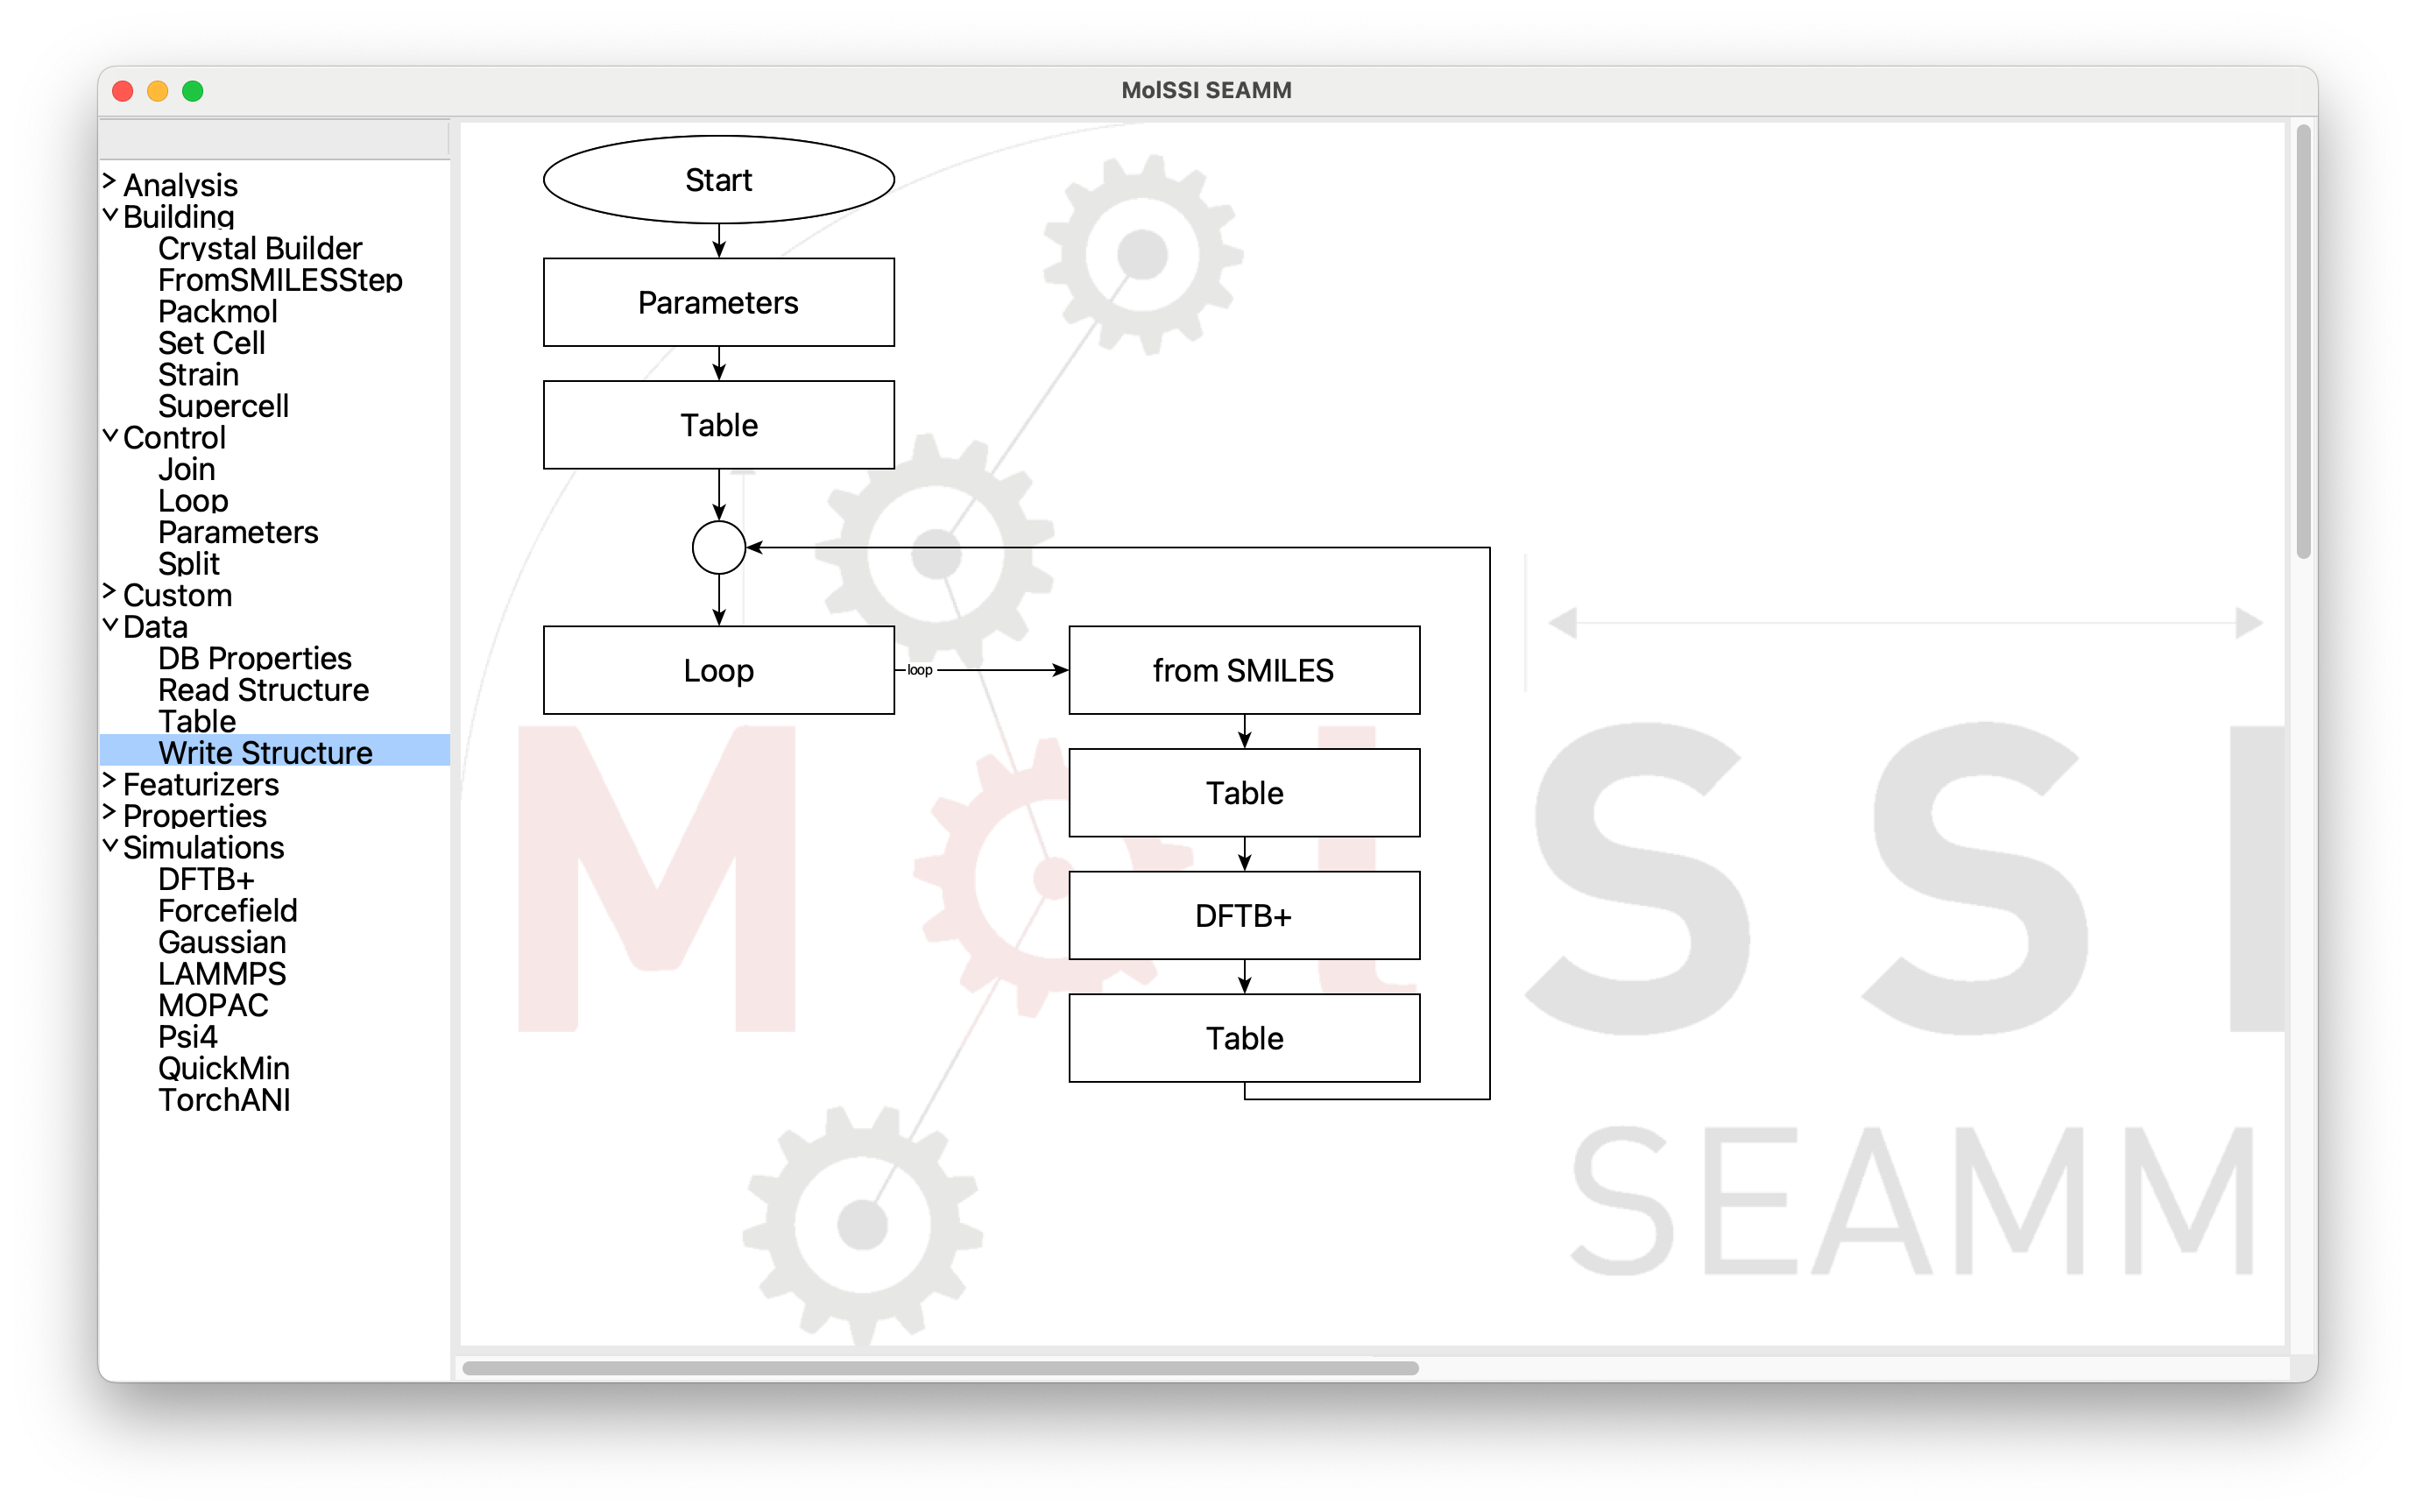
The flowchart we want looks like this:
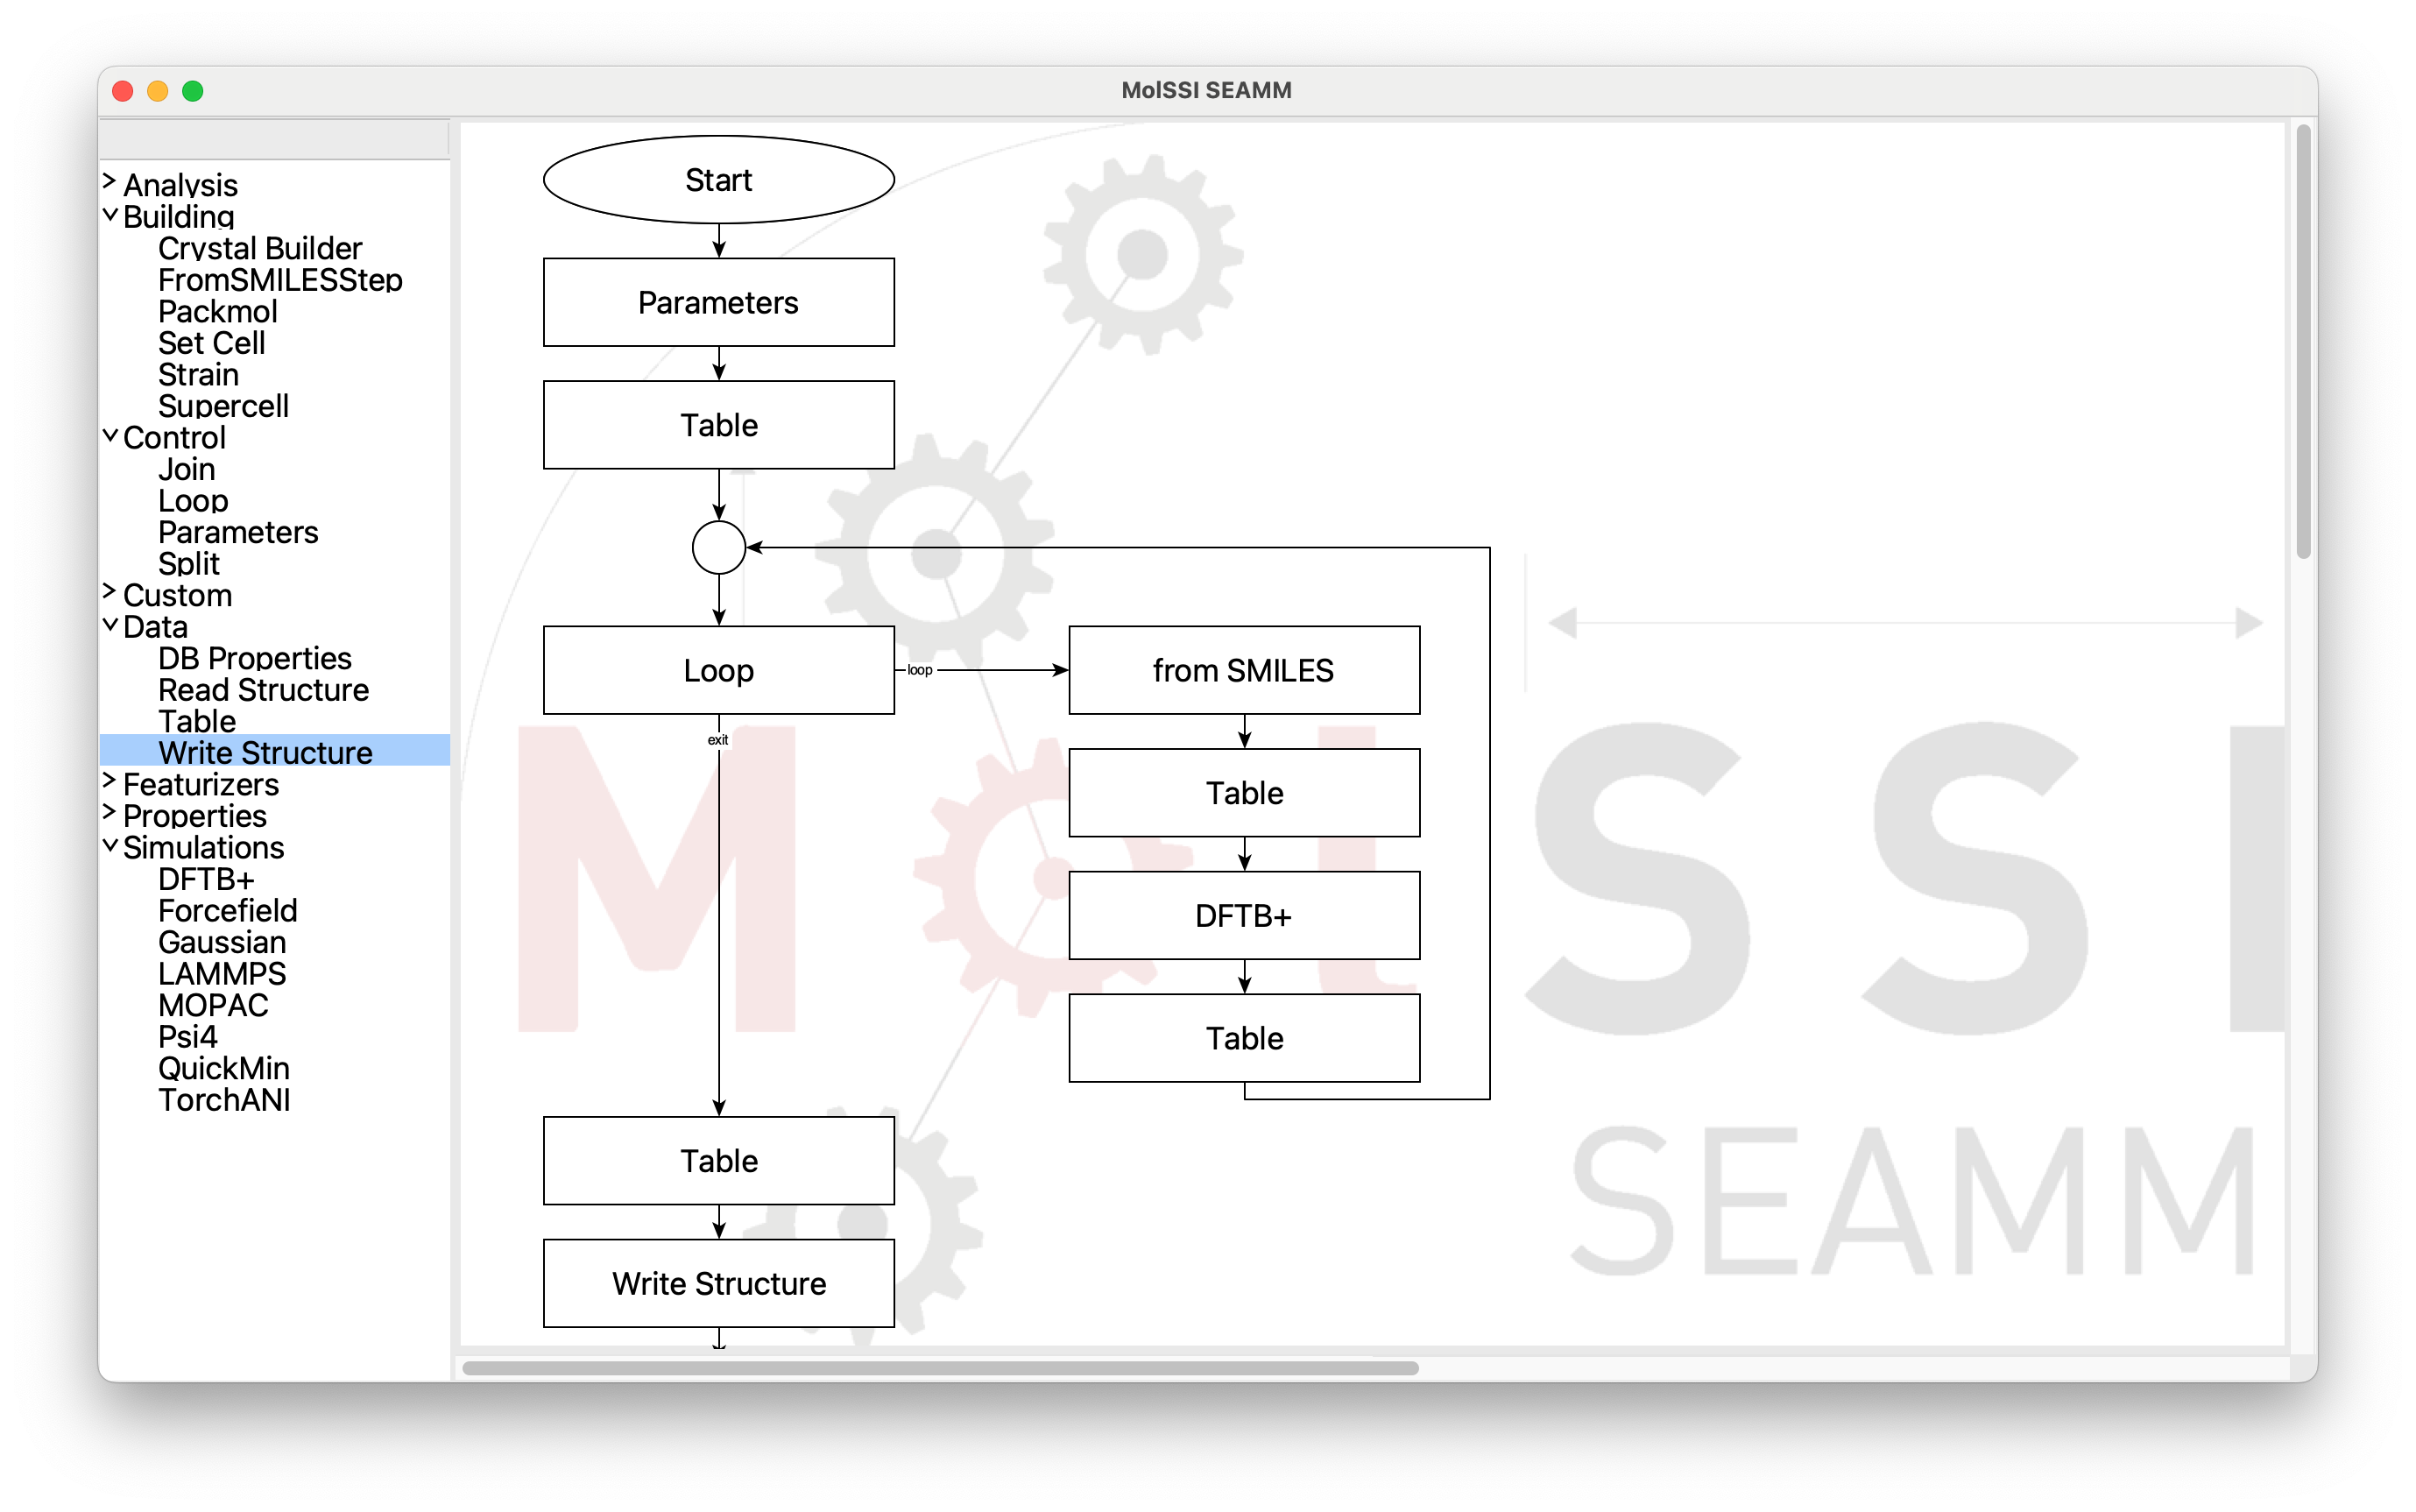
The final flowchart#
By now you find it fairly straightforward to make the (empty) flowchart, but there are a couple steps that are worth mentioning. We’ll go into more detail about how to edit the steps.
You can see on the left of the picture where the steps come from. Parameters is
under Control as are Join, which is the circle, and Loop. Table is under
Data, and fromSMILES and DFTB+ you already know. When you add the next step
after the Loop step it will go to the right. So just clieck on the steps on the left
until you get to the second Table step at the end of the loop:
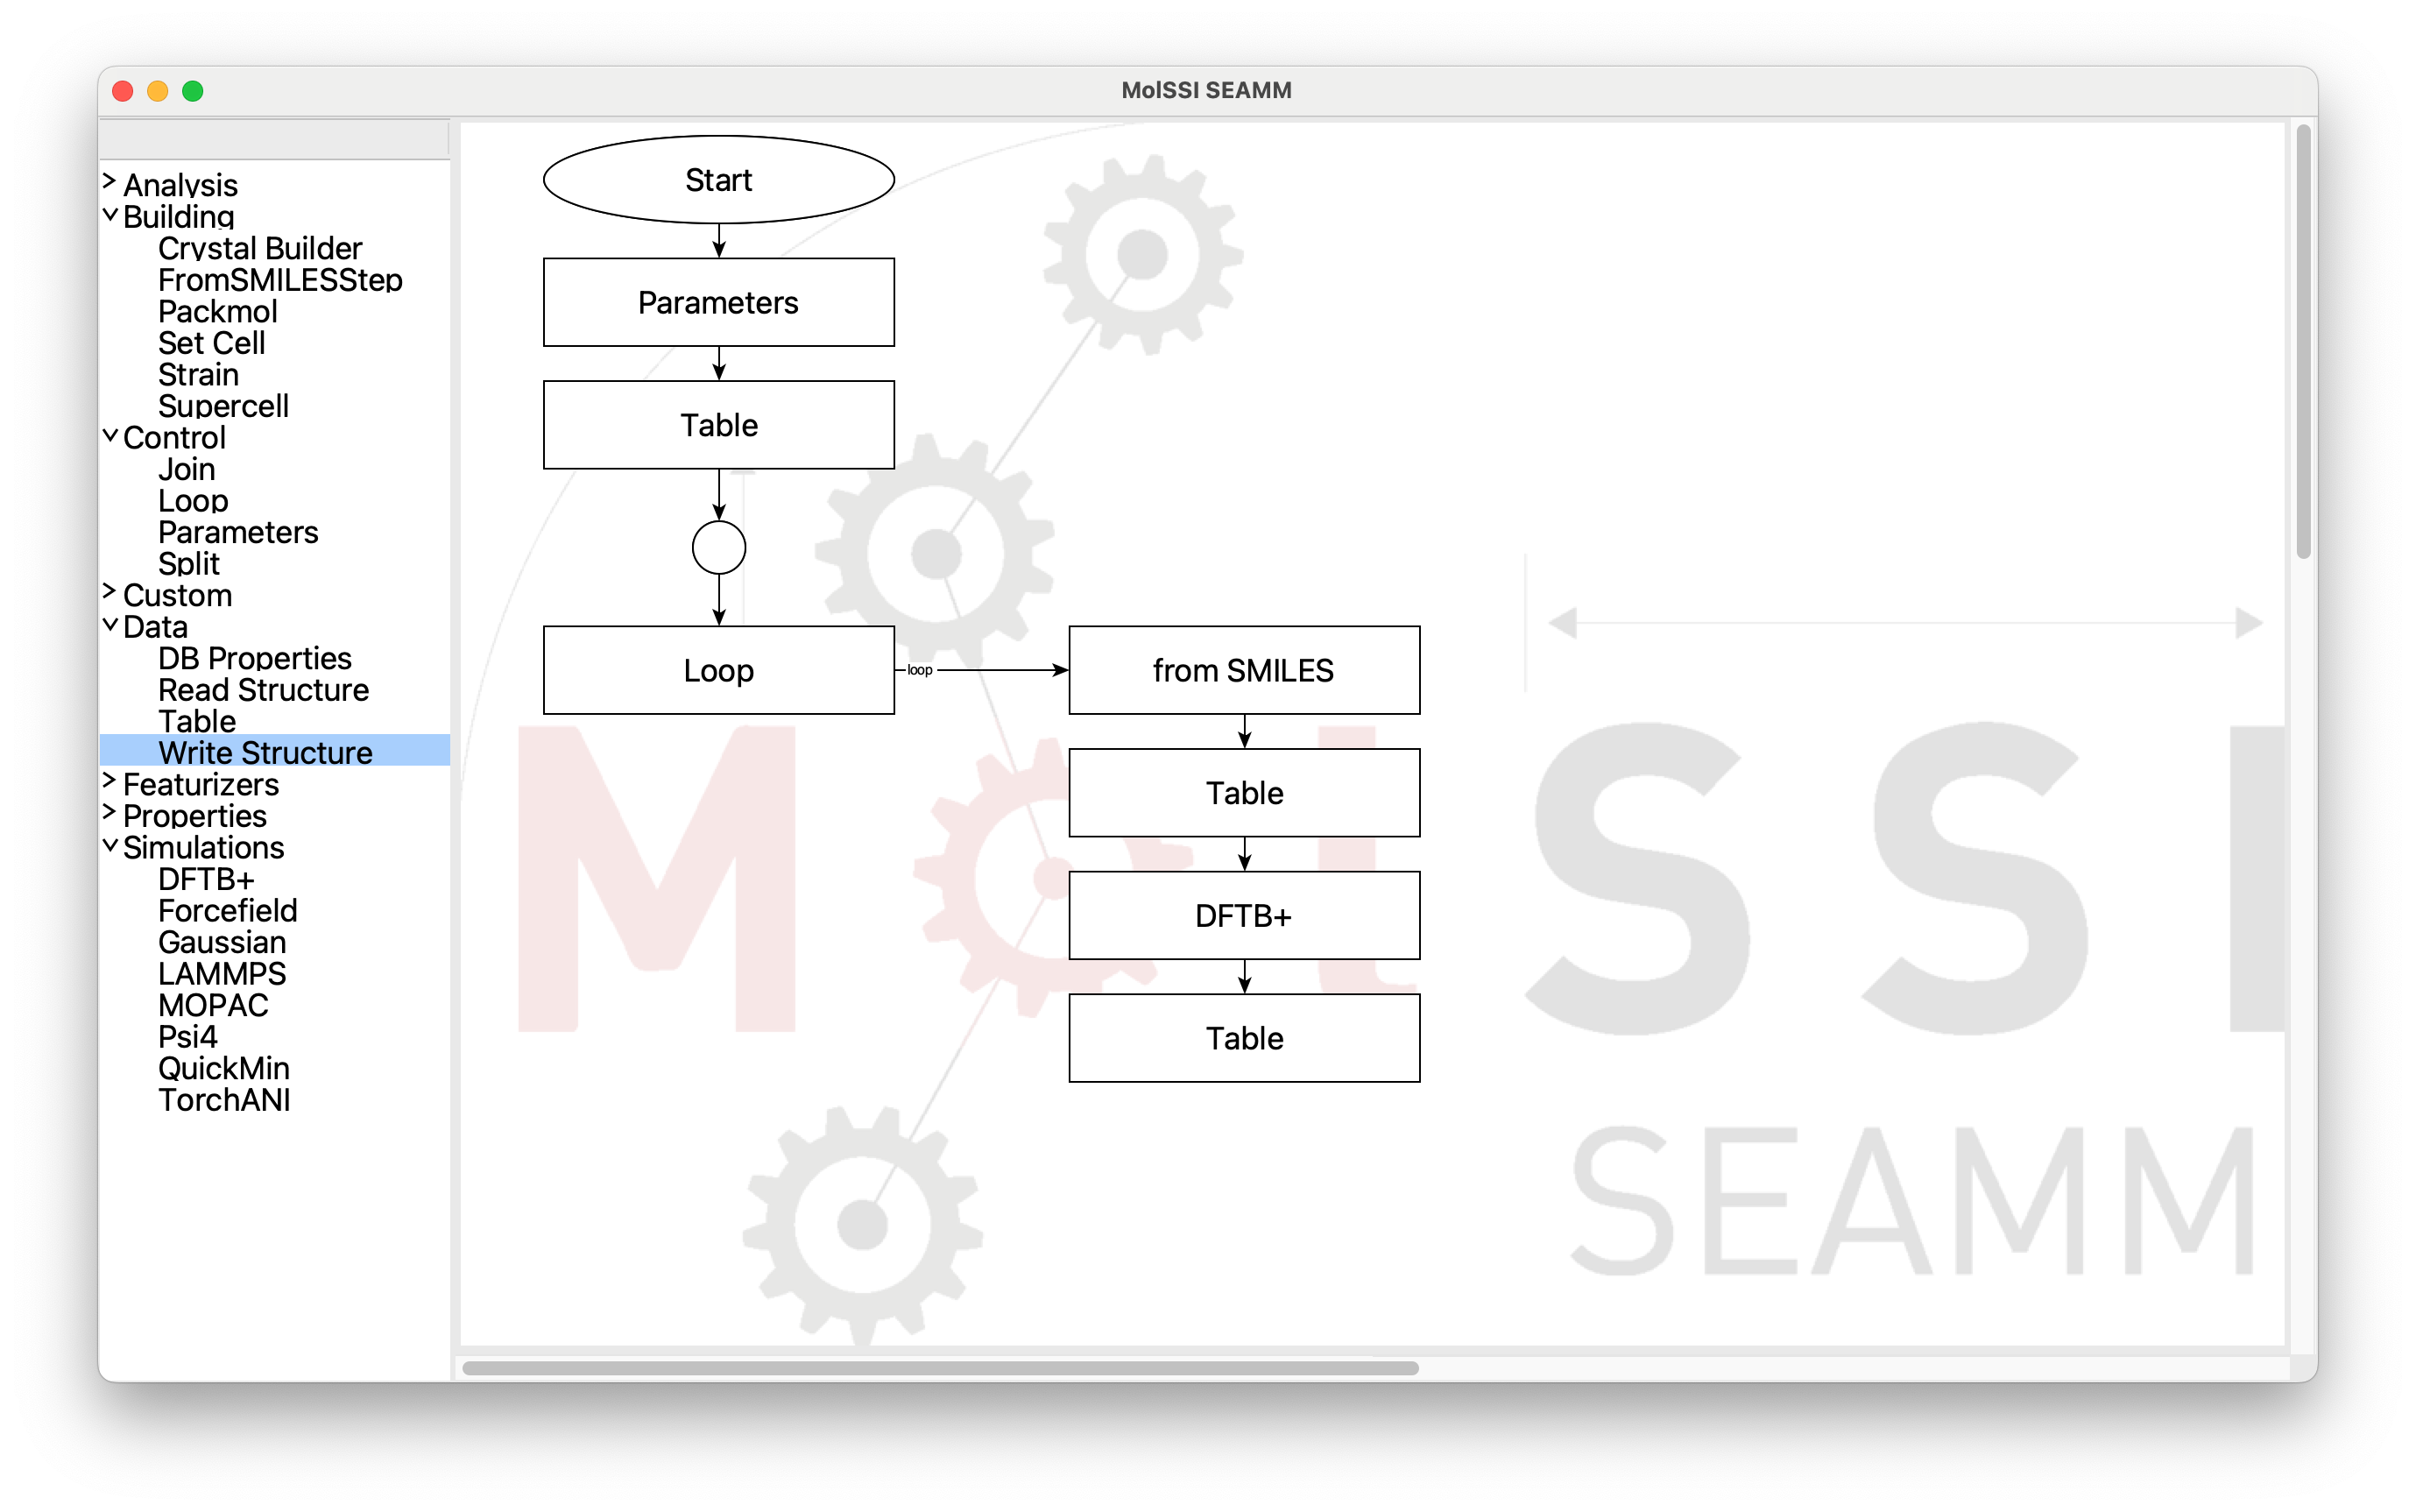
Partly Built Flowchart#
At this point you have to manually connect the last Table step back to the Join
step. Place the cursor over the last Table step. Small dots will appear around
it. Move the cursor over the center bottom dot, which will be larger:

Selecting the Starting Point for the Connection#
Click on the mouse-button and drag to the circular Join step, and find the
connection point on the right side:
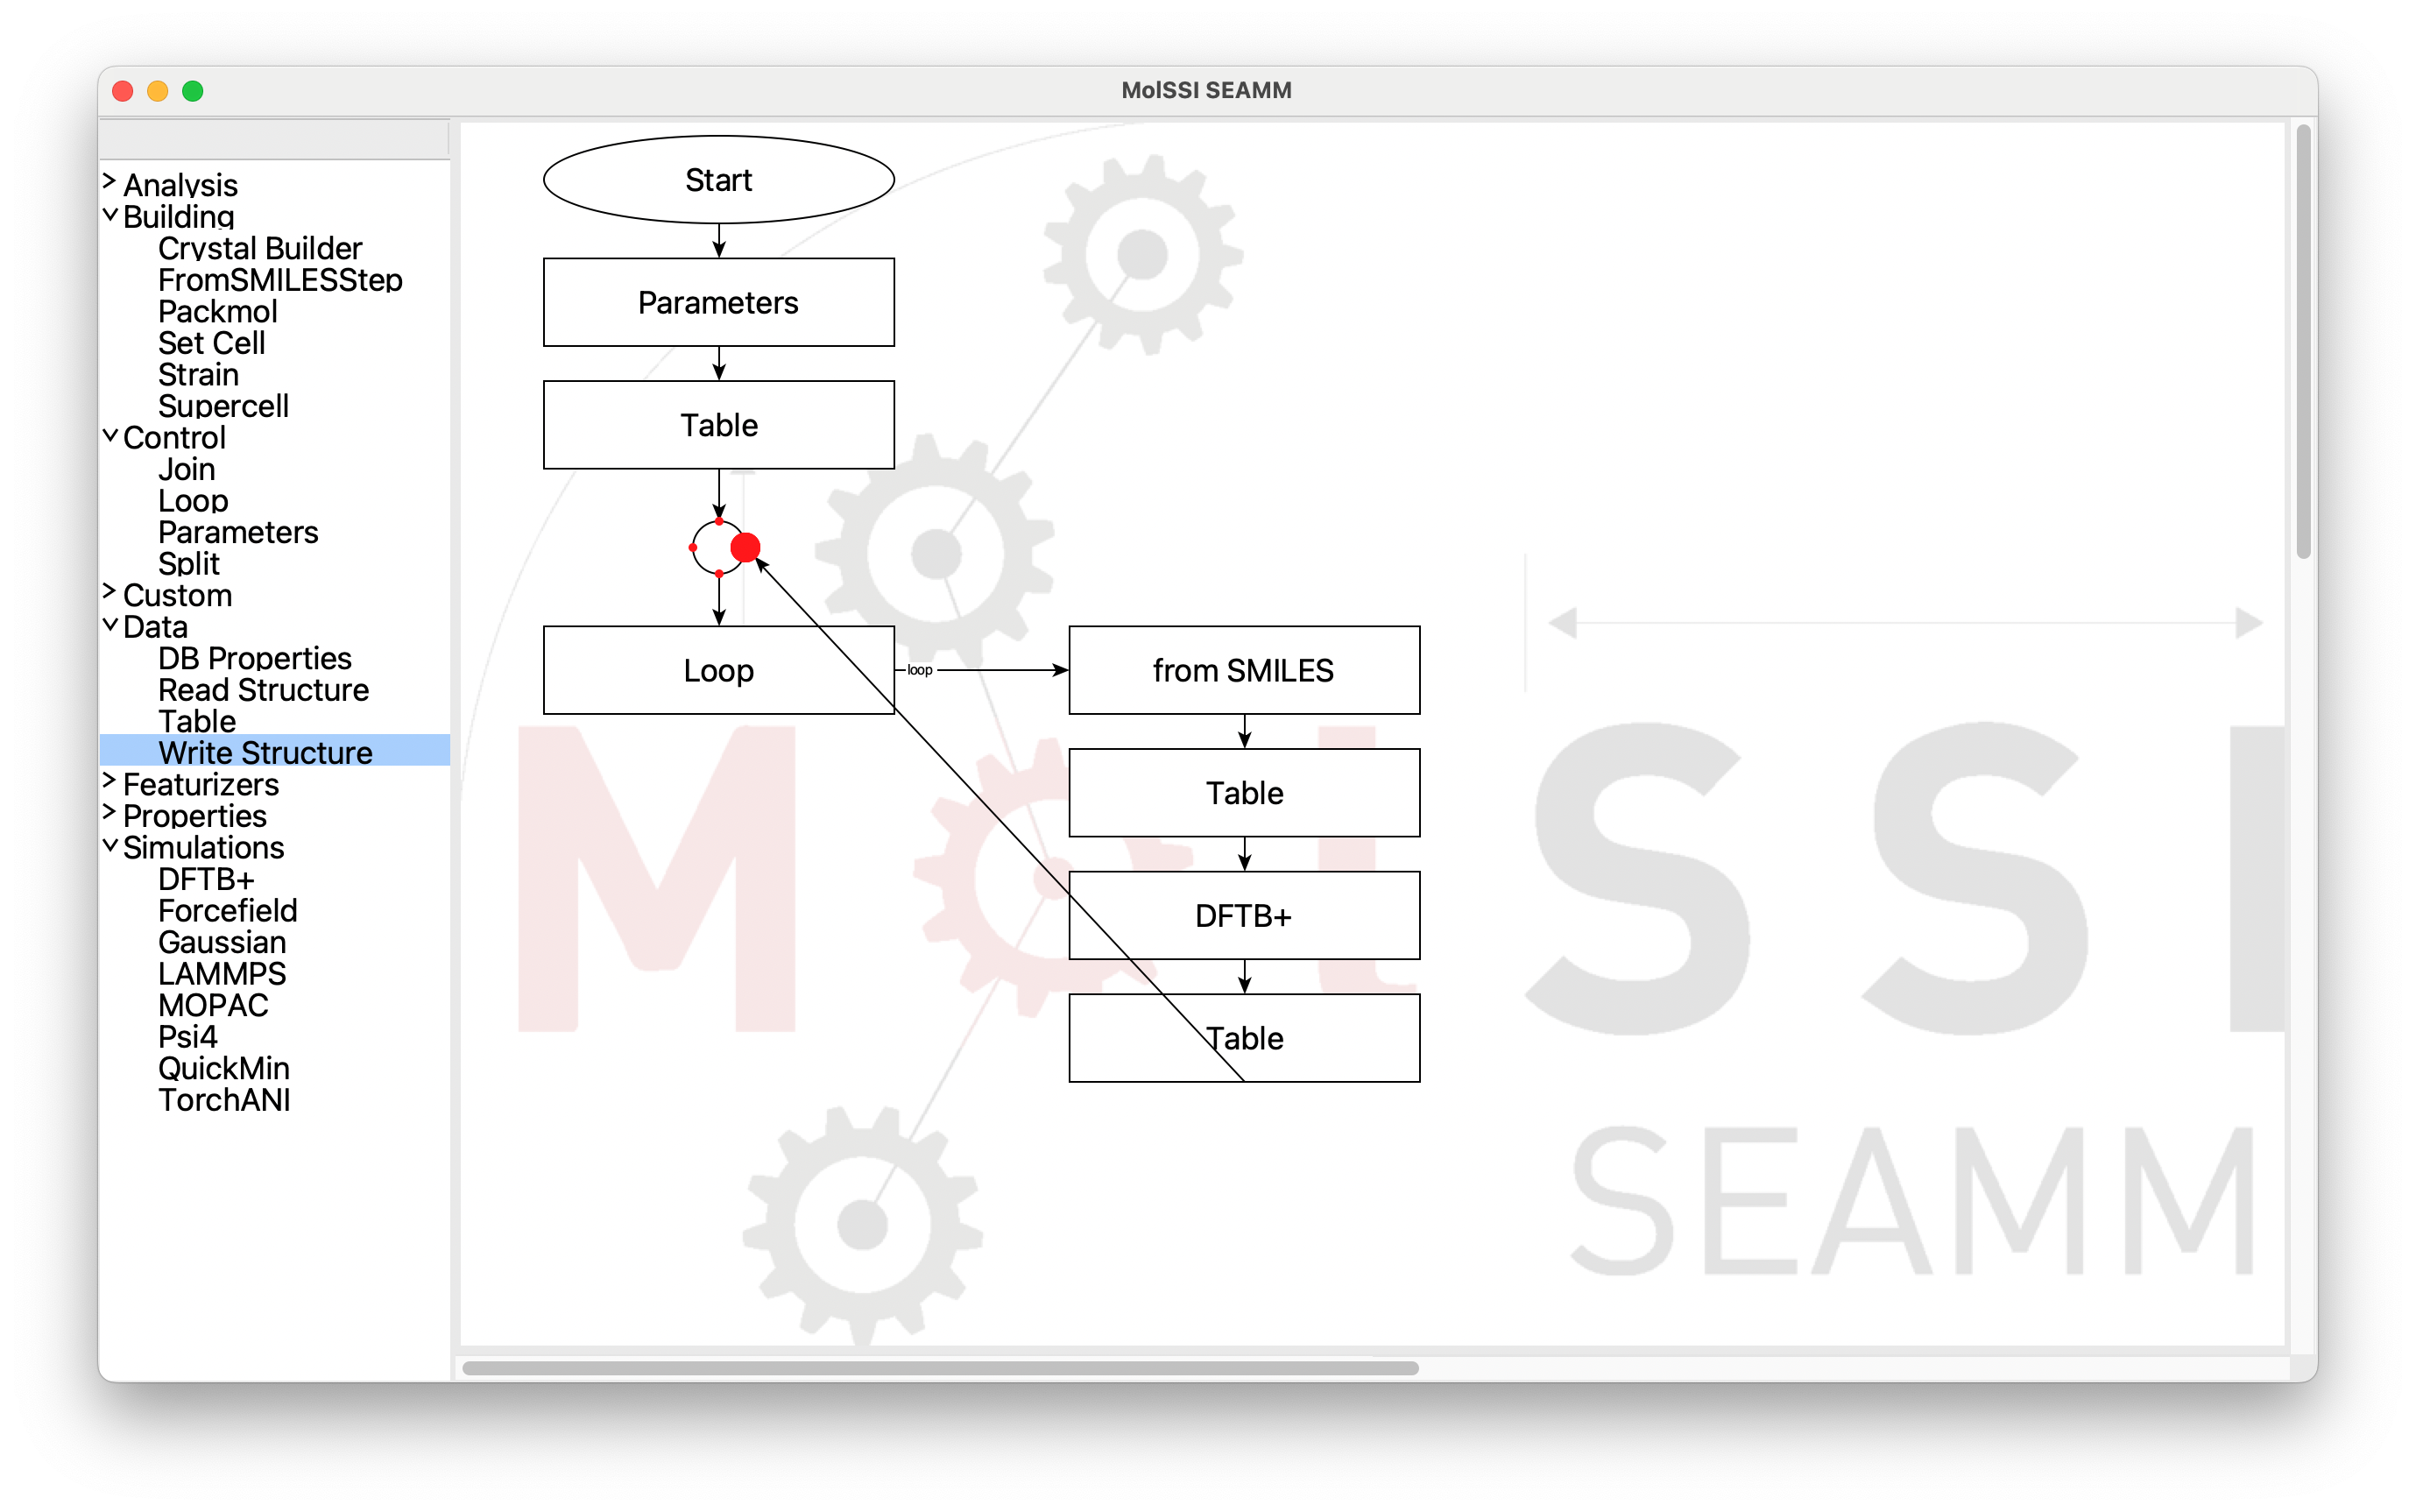
Dragging to the End Point for the Connection#
When the red dot on the Join step becaomes large, let go of the mouse to drop the
connection onto the step. If the arrow disappears it means that you missed the
connection point. Try again. It should look like this:
Successful Connection#
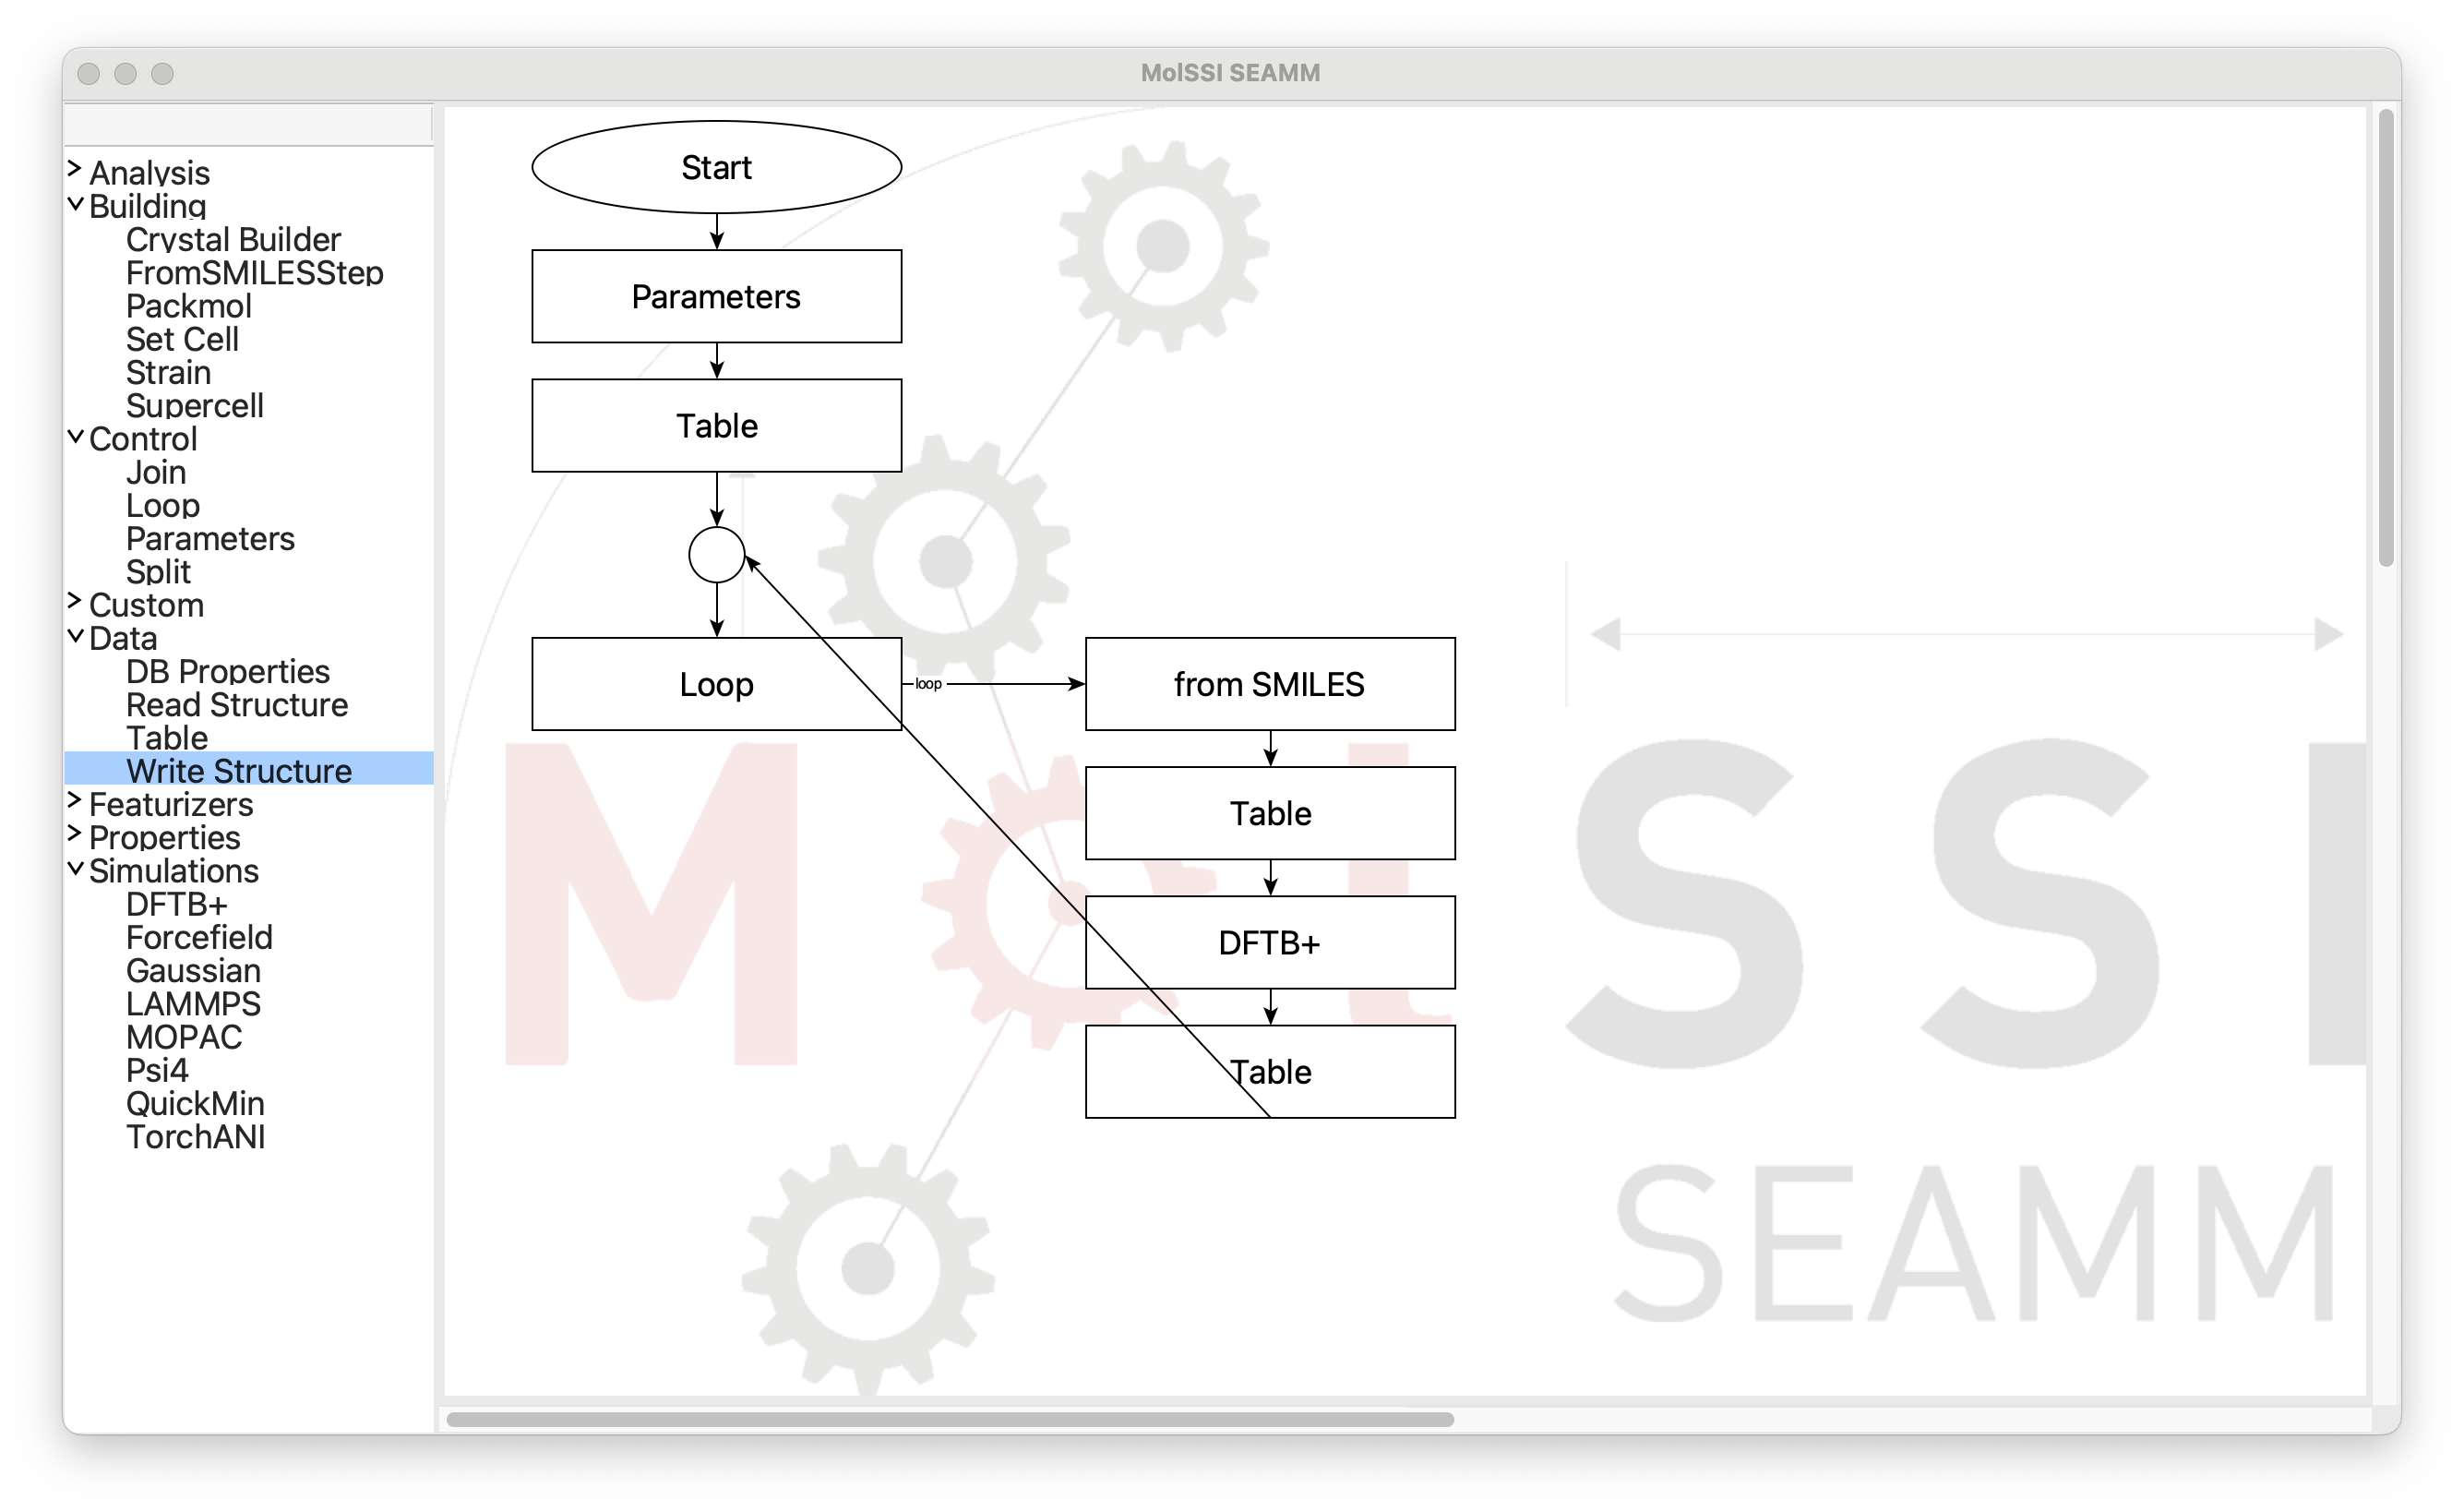
Almost there! It is a bit ugly with the diagonal connection, so clean it up with the Edit menu and select Clean Layout or use the accelerator (⌘L on a Mac, ^L on Windows or Linux):
Flowchart after Cleaning Up#
To finish, add the final Table and Write Structure steps after the
loop. Cleaning the layout one more time will move them below the loop, if you wish.
Editing the Steps#
Next we need to edit each of the steps to have it do what we need. This is simple, but a bit tedious, so the next section will just be a few words and lots of pictures. Fill out the dialogs as the pictures show.
The
Parameterstep at the beginning needs to have a mandatory parameters names structures that is a string with one or more values: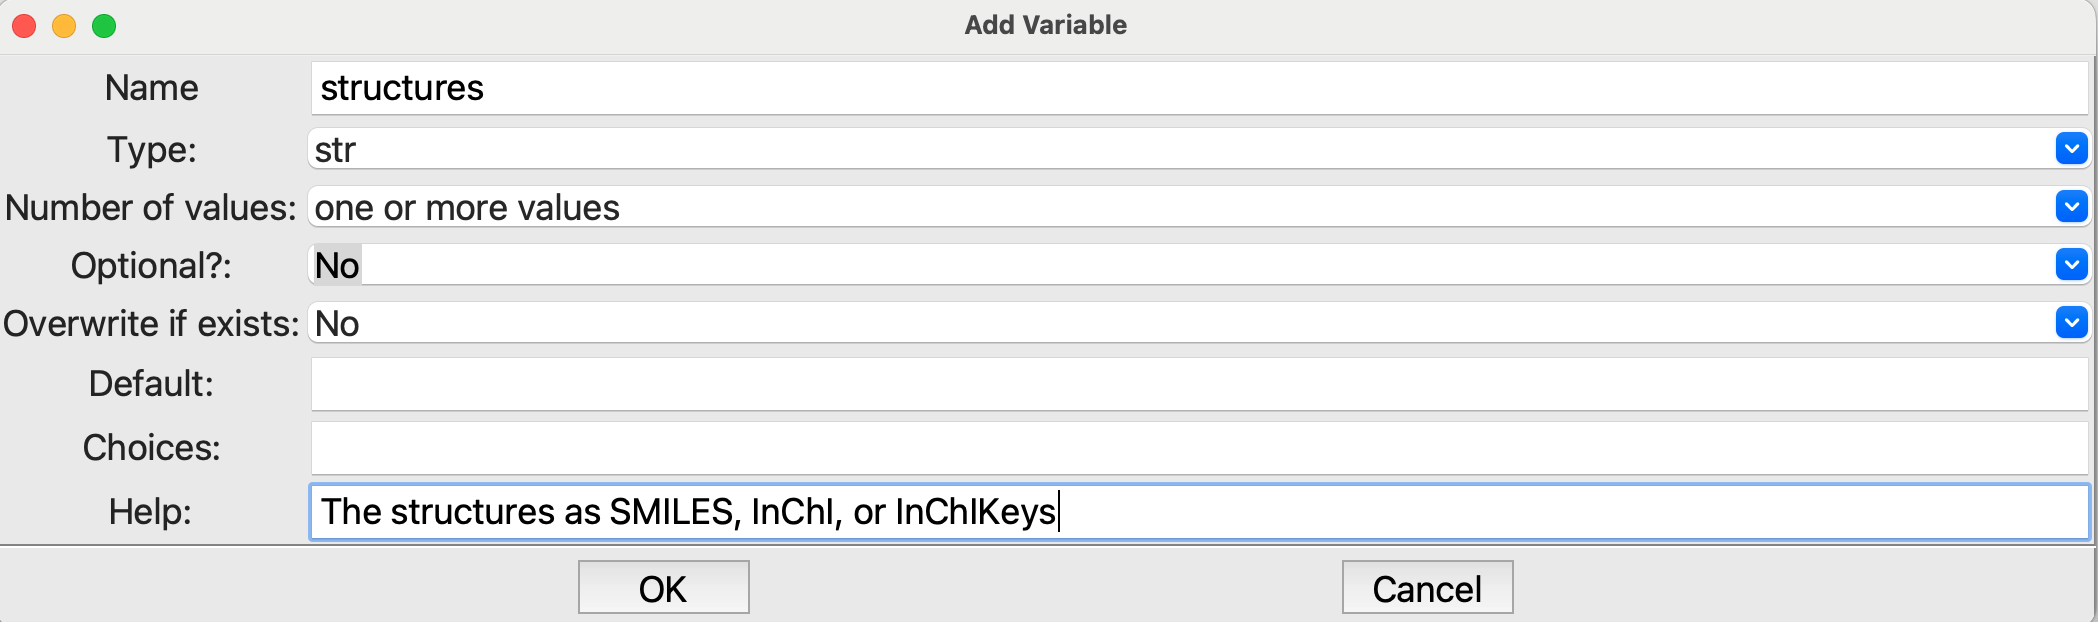
Editing the Parameters step#
For the first
Tablestep we create a table and add a string column named Structure: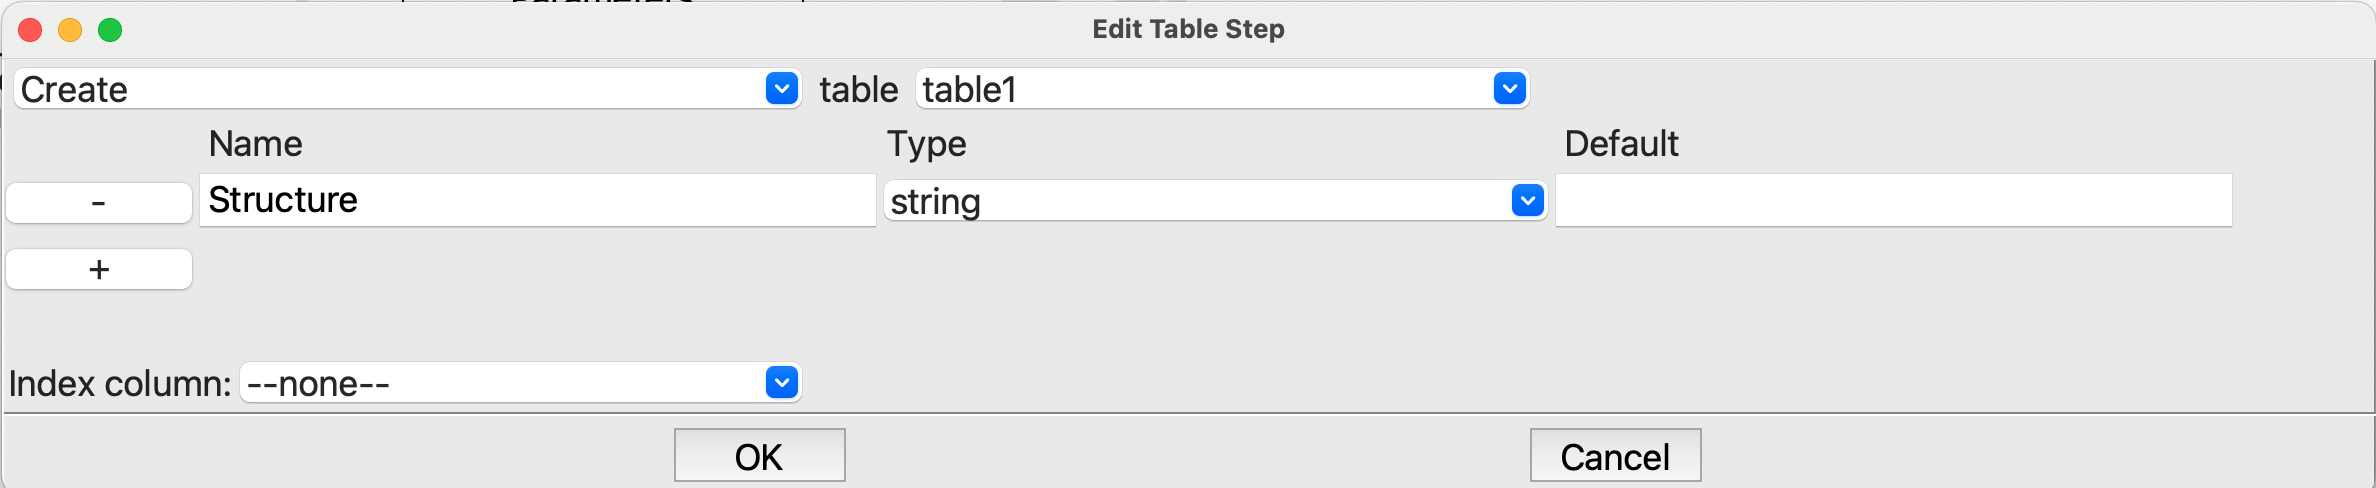
Editing the first Table step#
There is nothing to do for the
Joinstep so on to theLoopstep. Here we want a Foreach loop for structure in $structures: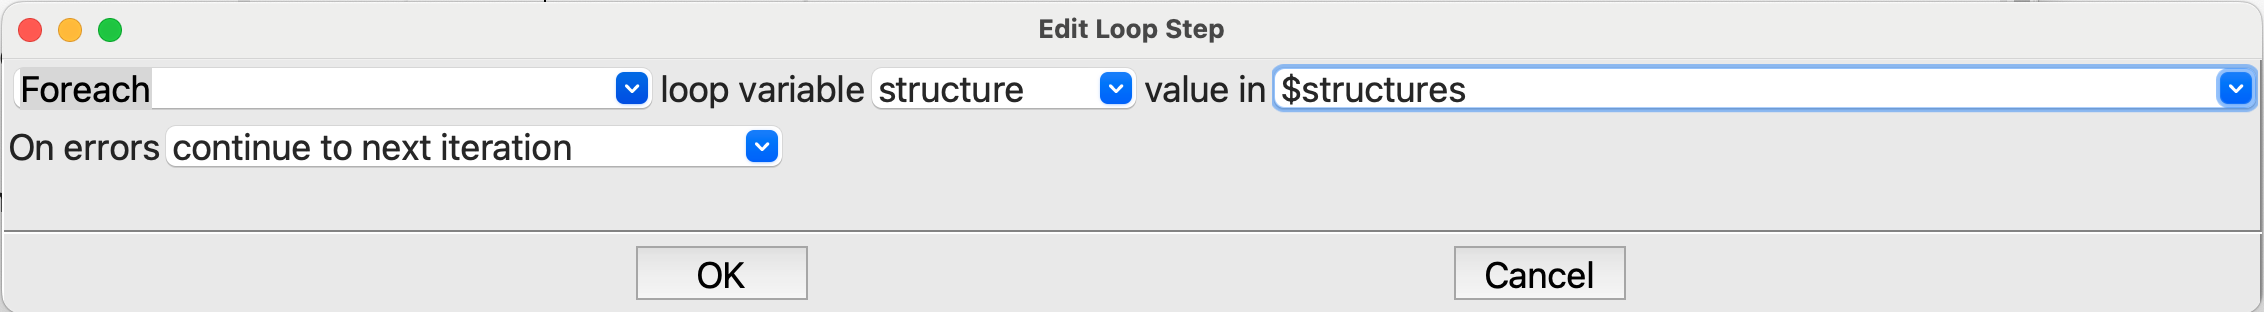
Editing the Loop step#
The
from SMILESstep is similar to what we did in the third tutorial. Set the Input: field to $structure. This time, however, pay attention to the last three items, which tell the code where to put the new structure and what to call it. Choose Create a new system and configuration, with the system name use IUPAC name and configuration name initial.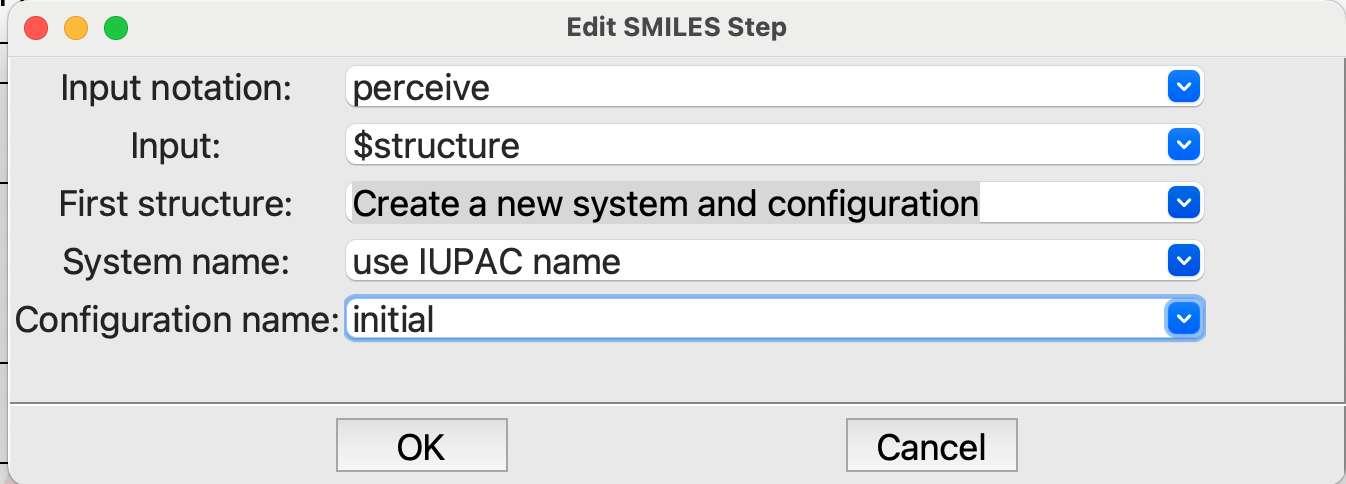
Editing the from SMILES step#
For the first
Tablestep in the loop we want to append a row to the table and put the name of the structure ($_system_db.system.name) in the Structure column that we made in the firstTablestep: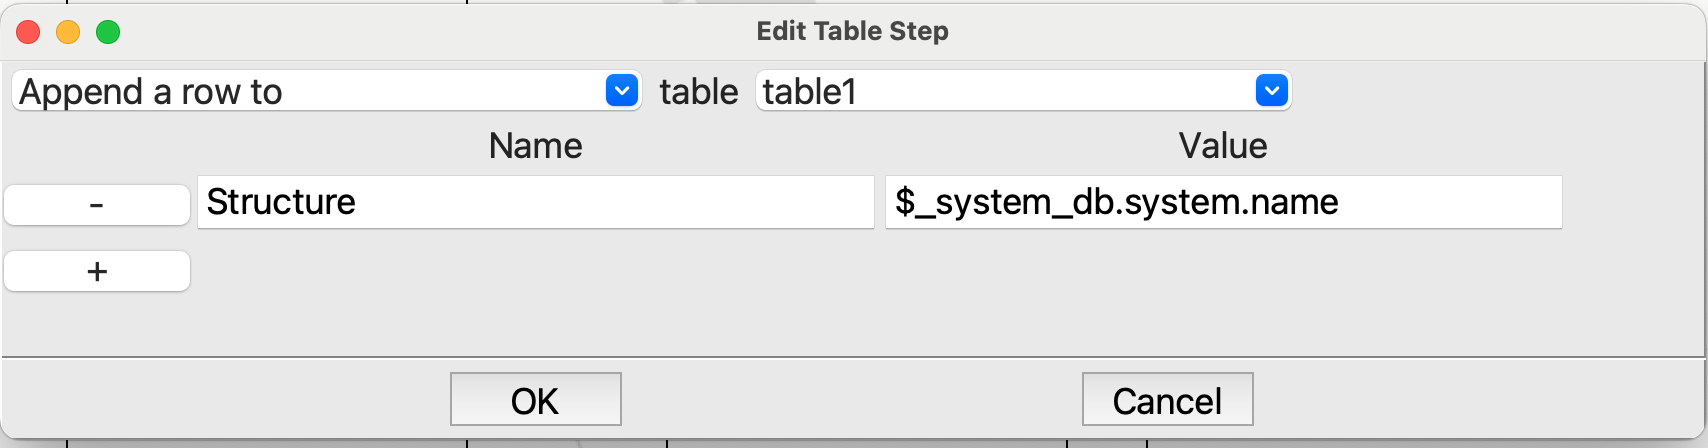
Editing the first Table step in the loop#
The rather odd string that you used needs a bit of explaining. SEAMM has a few global variables that it uses internally that can also be used in the flowcharts. _system_db is the internal database that sotres all the structures, etc. The global variables start with an underscore to keep them separate from your variables, so don’t create variables starting with an underscore! As before, the initial dollar sign ($) indicates that this is a reference to a varibale, not a simple string. SEAMM is object-oriented, so $_system_db.system is always the current system, and $_system_db.system.name is the name of the system, which we just set in the previous step to the IUPAC name of the molecule. So the table will have the IUPAC names of the molecules in the structure column.
The
DFTB+is again much like it was in the other tutorials. We need aChoose Parametersstep. The defaults are fine, so there is no need to edit it. For theOptimizationstep the setting on the Parameters tab are fine. Note that the structure will be put in a new configuration. Click on the third tab, Results, and set it up like this: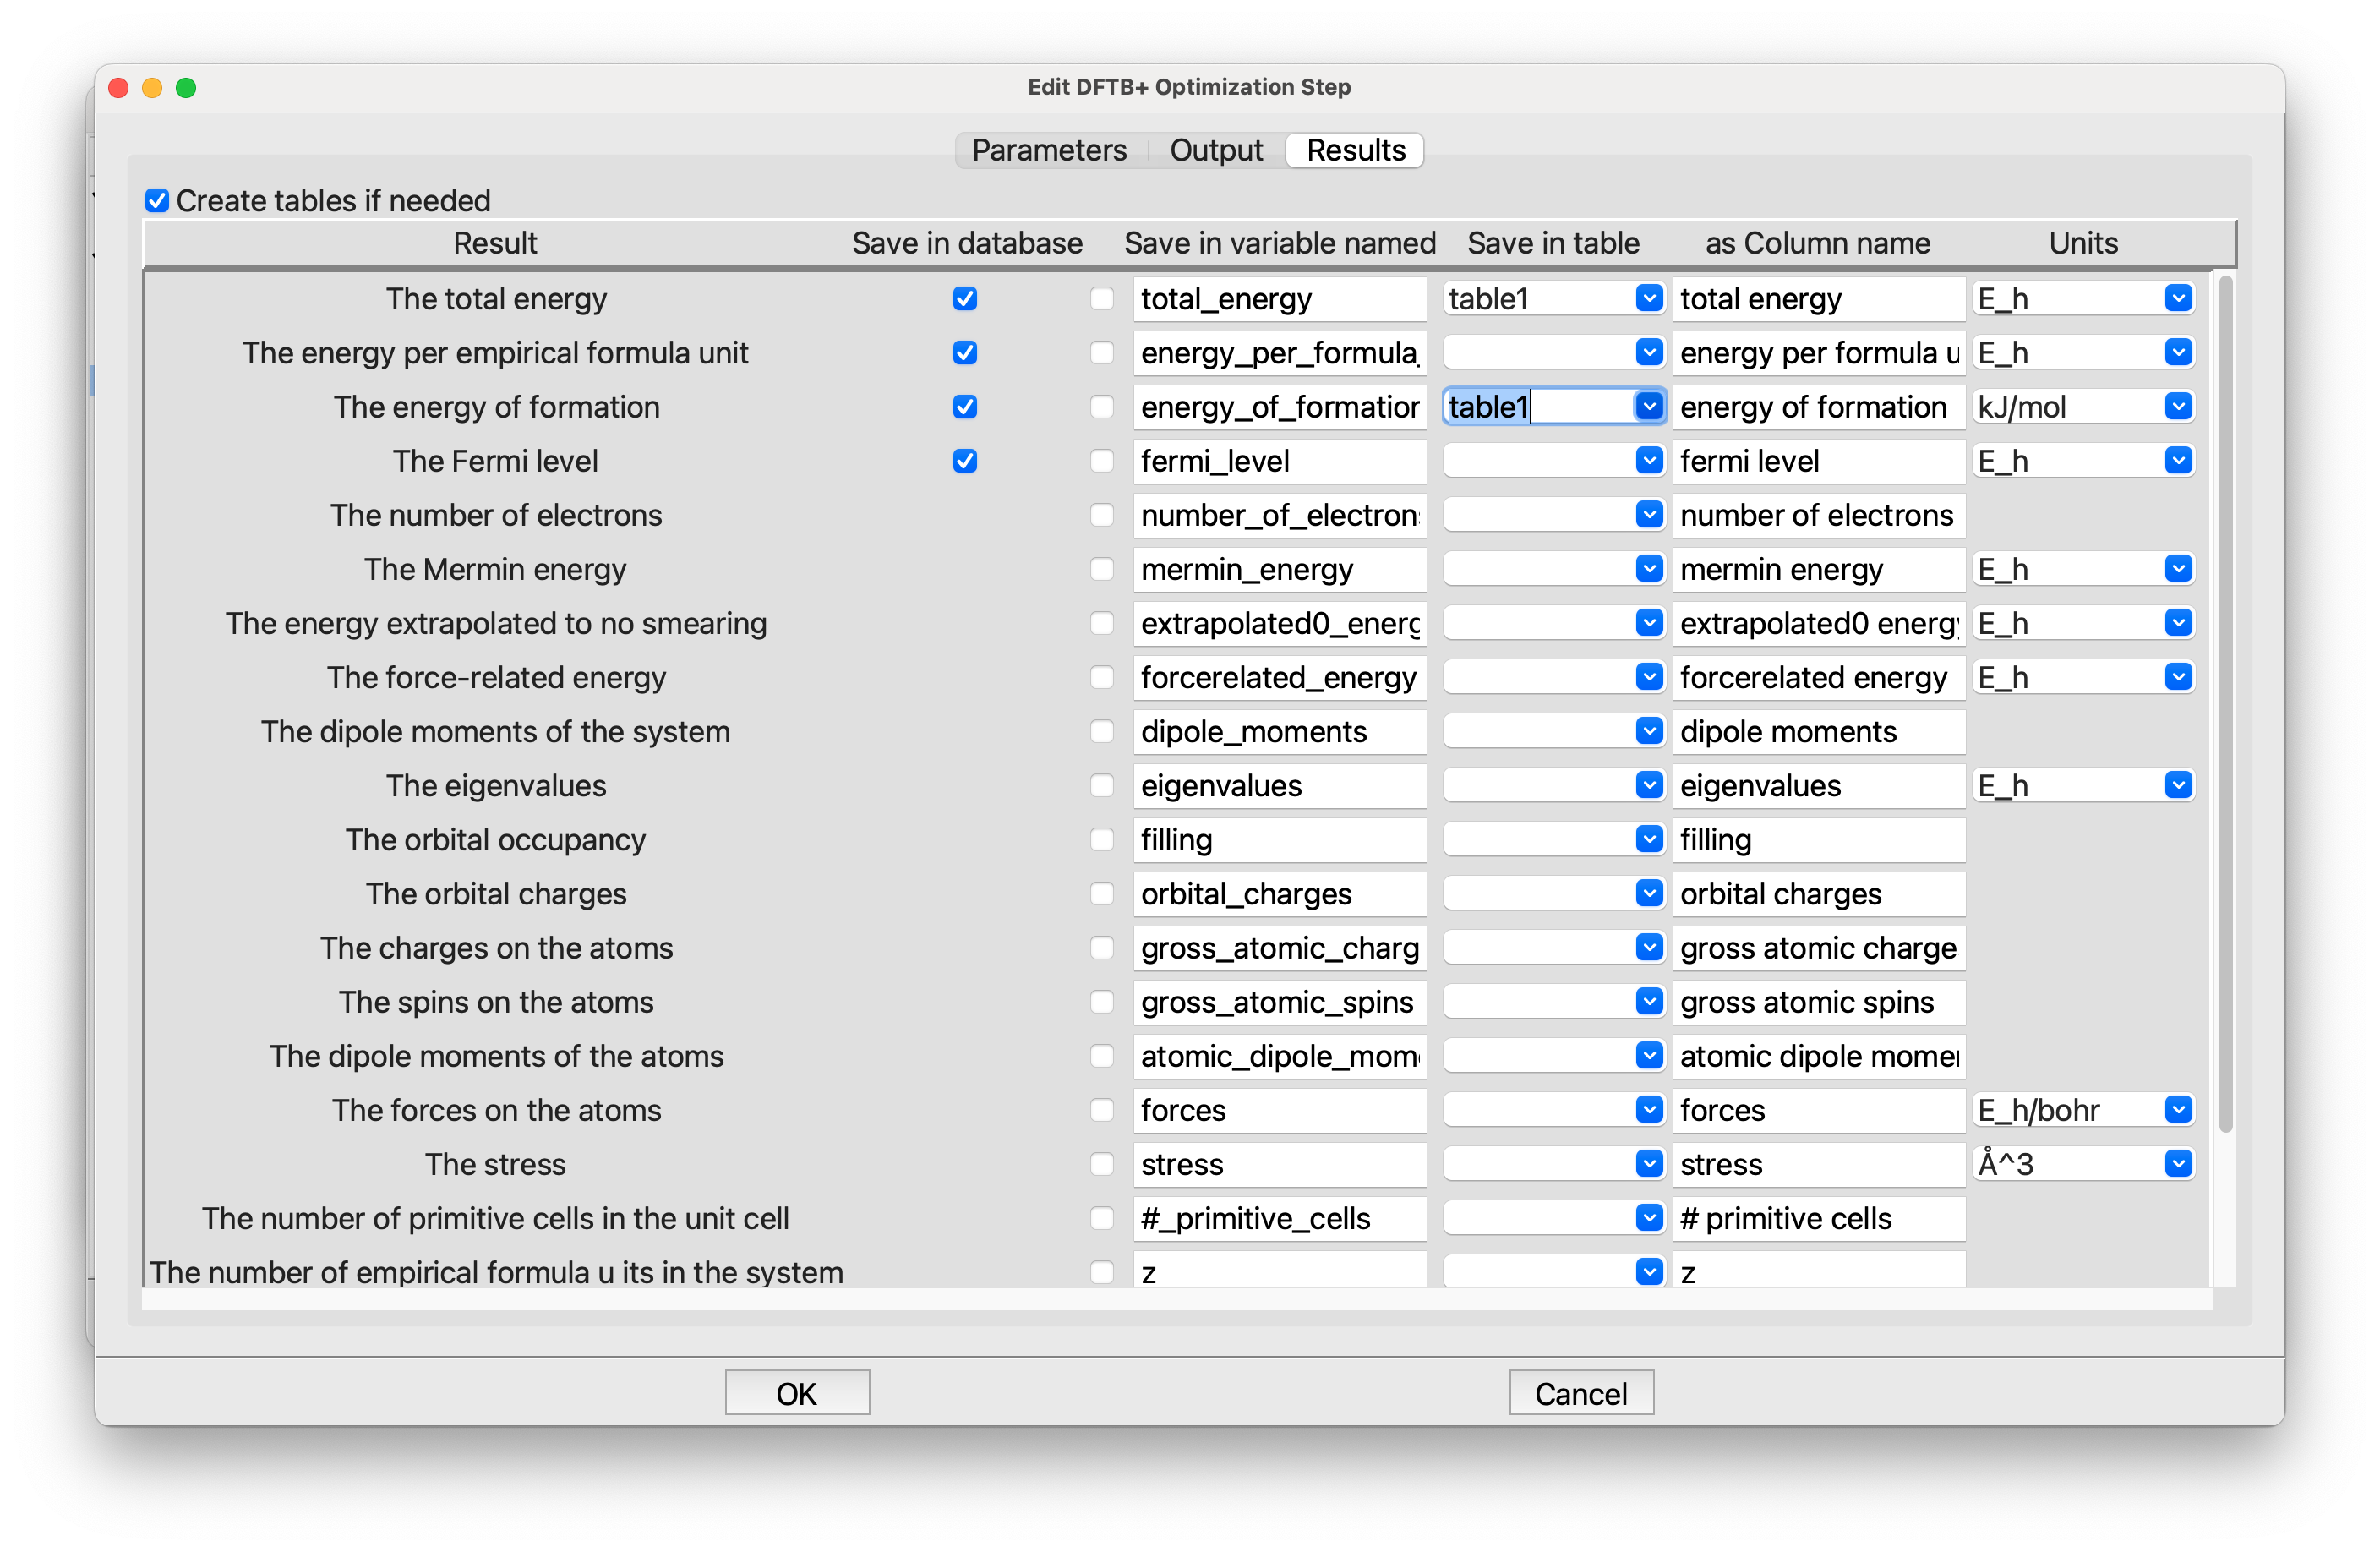
Editing the Optimization step, Results tab#
The results tab list all the results from the DFTB+ calculation, and allows you to save them in various places. You can save them in the database. Or as variables by checking the box just to the left of the variable name (which you can edit). We want to save the total energy and energy of formation in our table, which is named table1, so type that into the two entries in the Save in table column. The last column is used to pick the units, but the defaults of E_h for the total energy and kJ/mol for the energy of formation are fine, so there is no need to change them
The second
Tablestep, at the end of the loop. We want to save the table each pass through the loop so that we can see the results, and also so that we have them if the machine crashes or something else happens. It is not very important for the calculations with DFTB+ because they are so fast, but with other, slower methods it is a good idea to save often: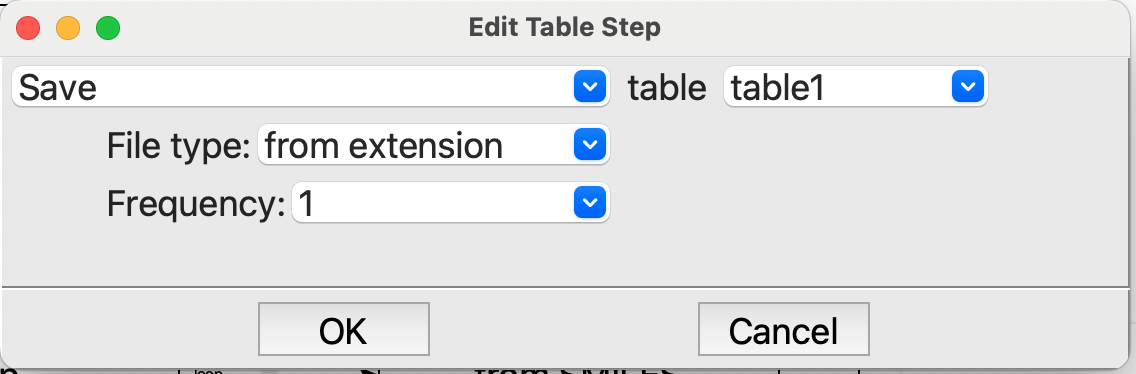
Editing the last Table step in the loop#
That finishes the loop. Now for the
Tablestep after the loop. All we want to do here is print the final table in the output: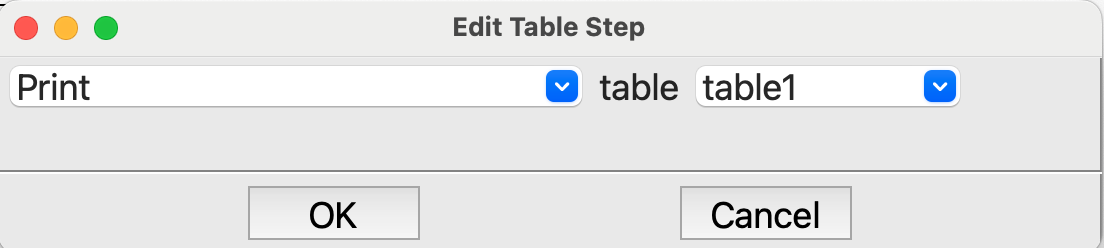
Editing the last Table step#
And the
Write Structurestep at the end of the flowchart. We want to write all the structures to the file structures.sdf: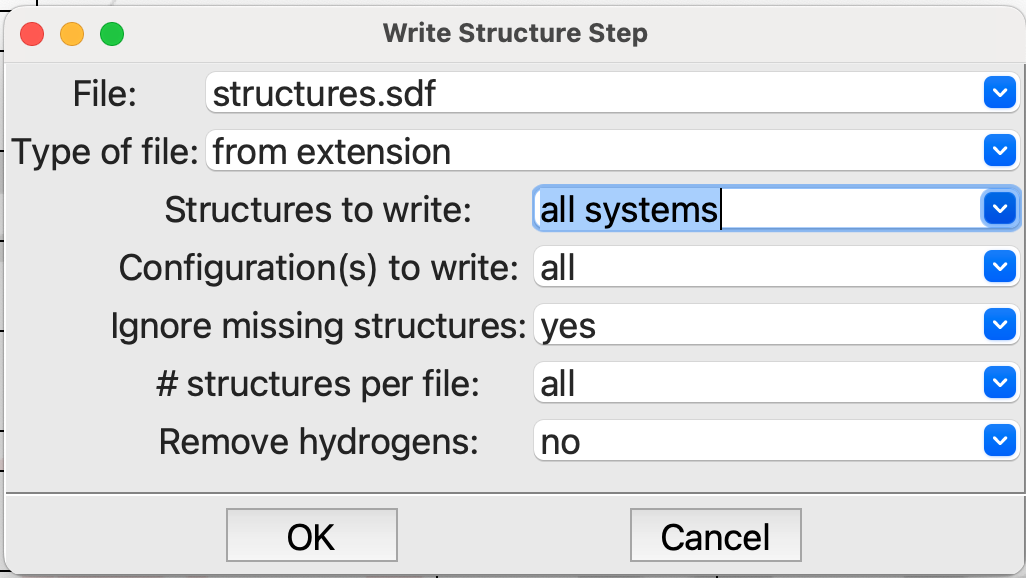
Editing the Write Structure step#
Note that both File and Structures to write need to be changed.
Running a Job#
Now to run a job! (File / Run or ⌘R on a Mac, ^R on Windows or Linux):
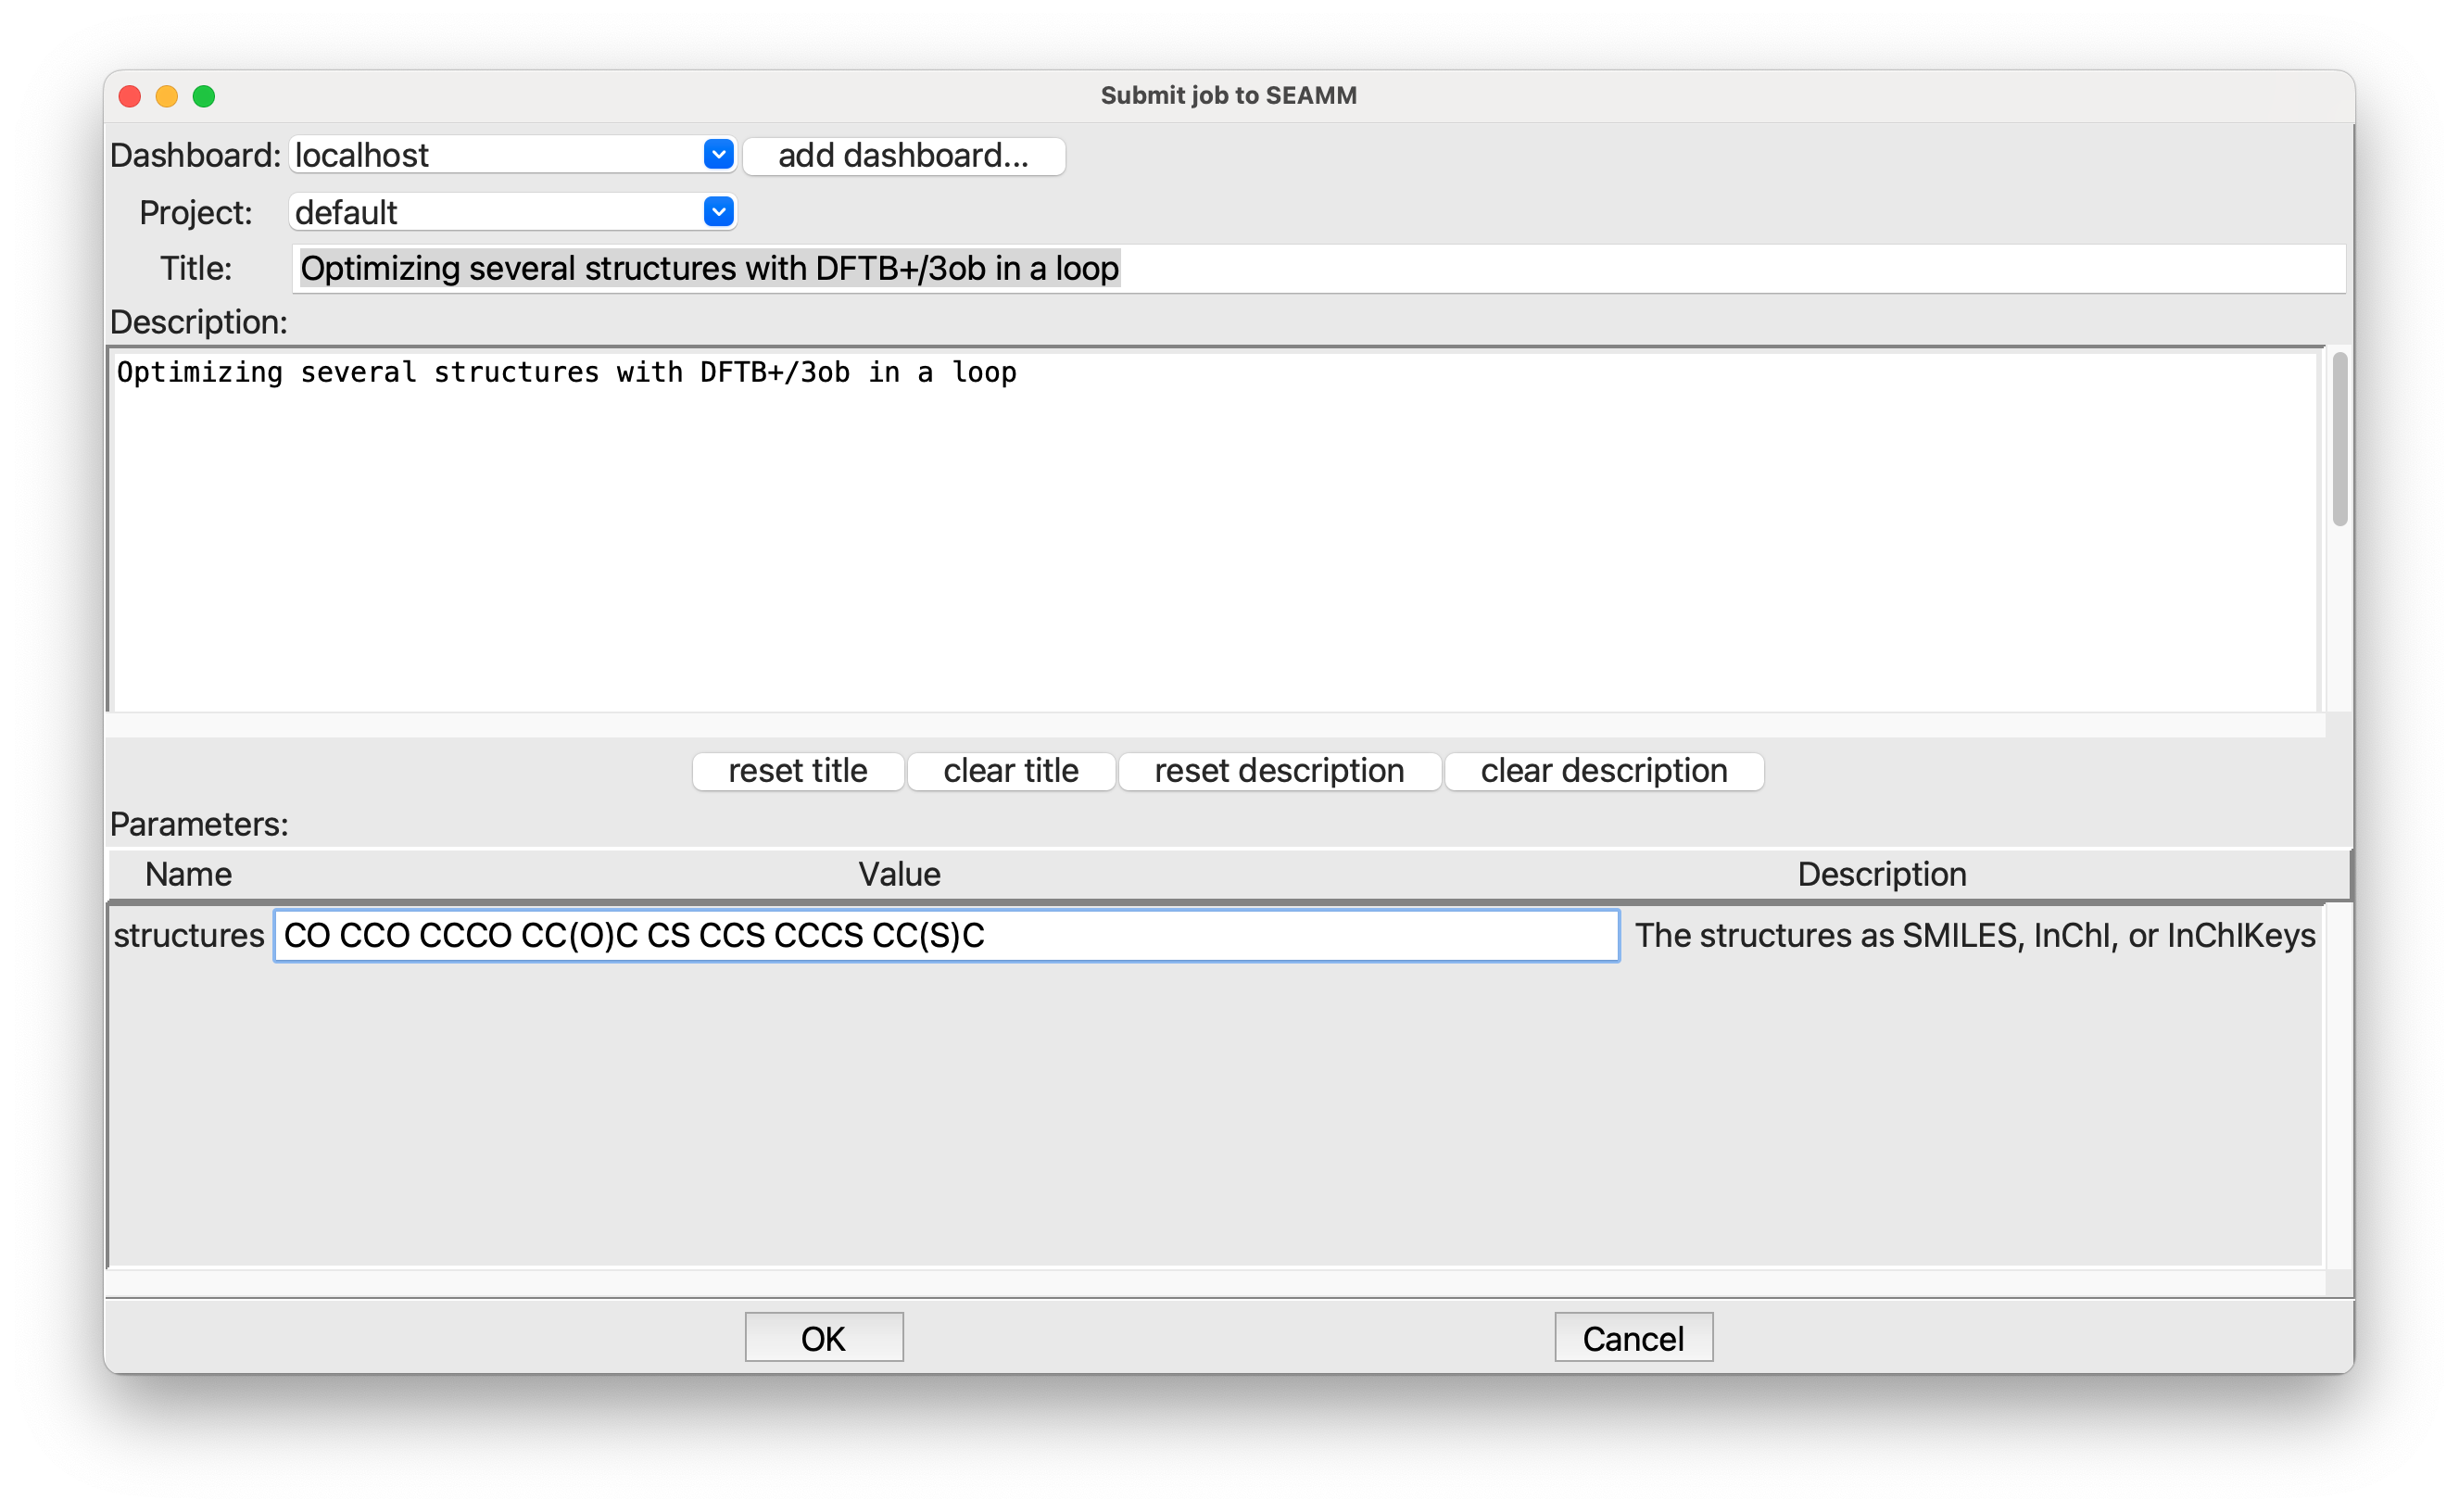
Submitting the job#
As always, you need to put in a title and description of the job. In the structures field, put in a list of structures separated by white space. I used the following:
CO CCO CCCO CC(O)C CS CCS CCCS CC(S)C
If you don’t know SMILES, don’t worry! These are quite simple: methanol, ethanol, 1-propanol, and 2-propanol, followed by their sulfur analogs.
Viewing the Results#
Bring up the Dashboard in your browser and find the job, checking that it has finished. In the files section of the left panel, click on table1.csv:
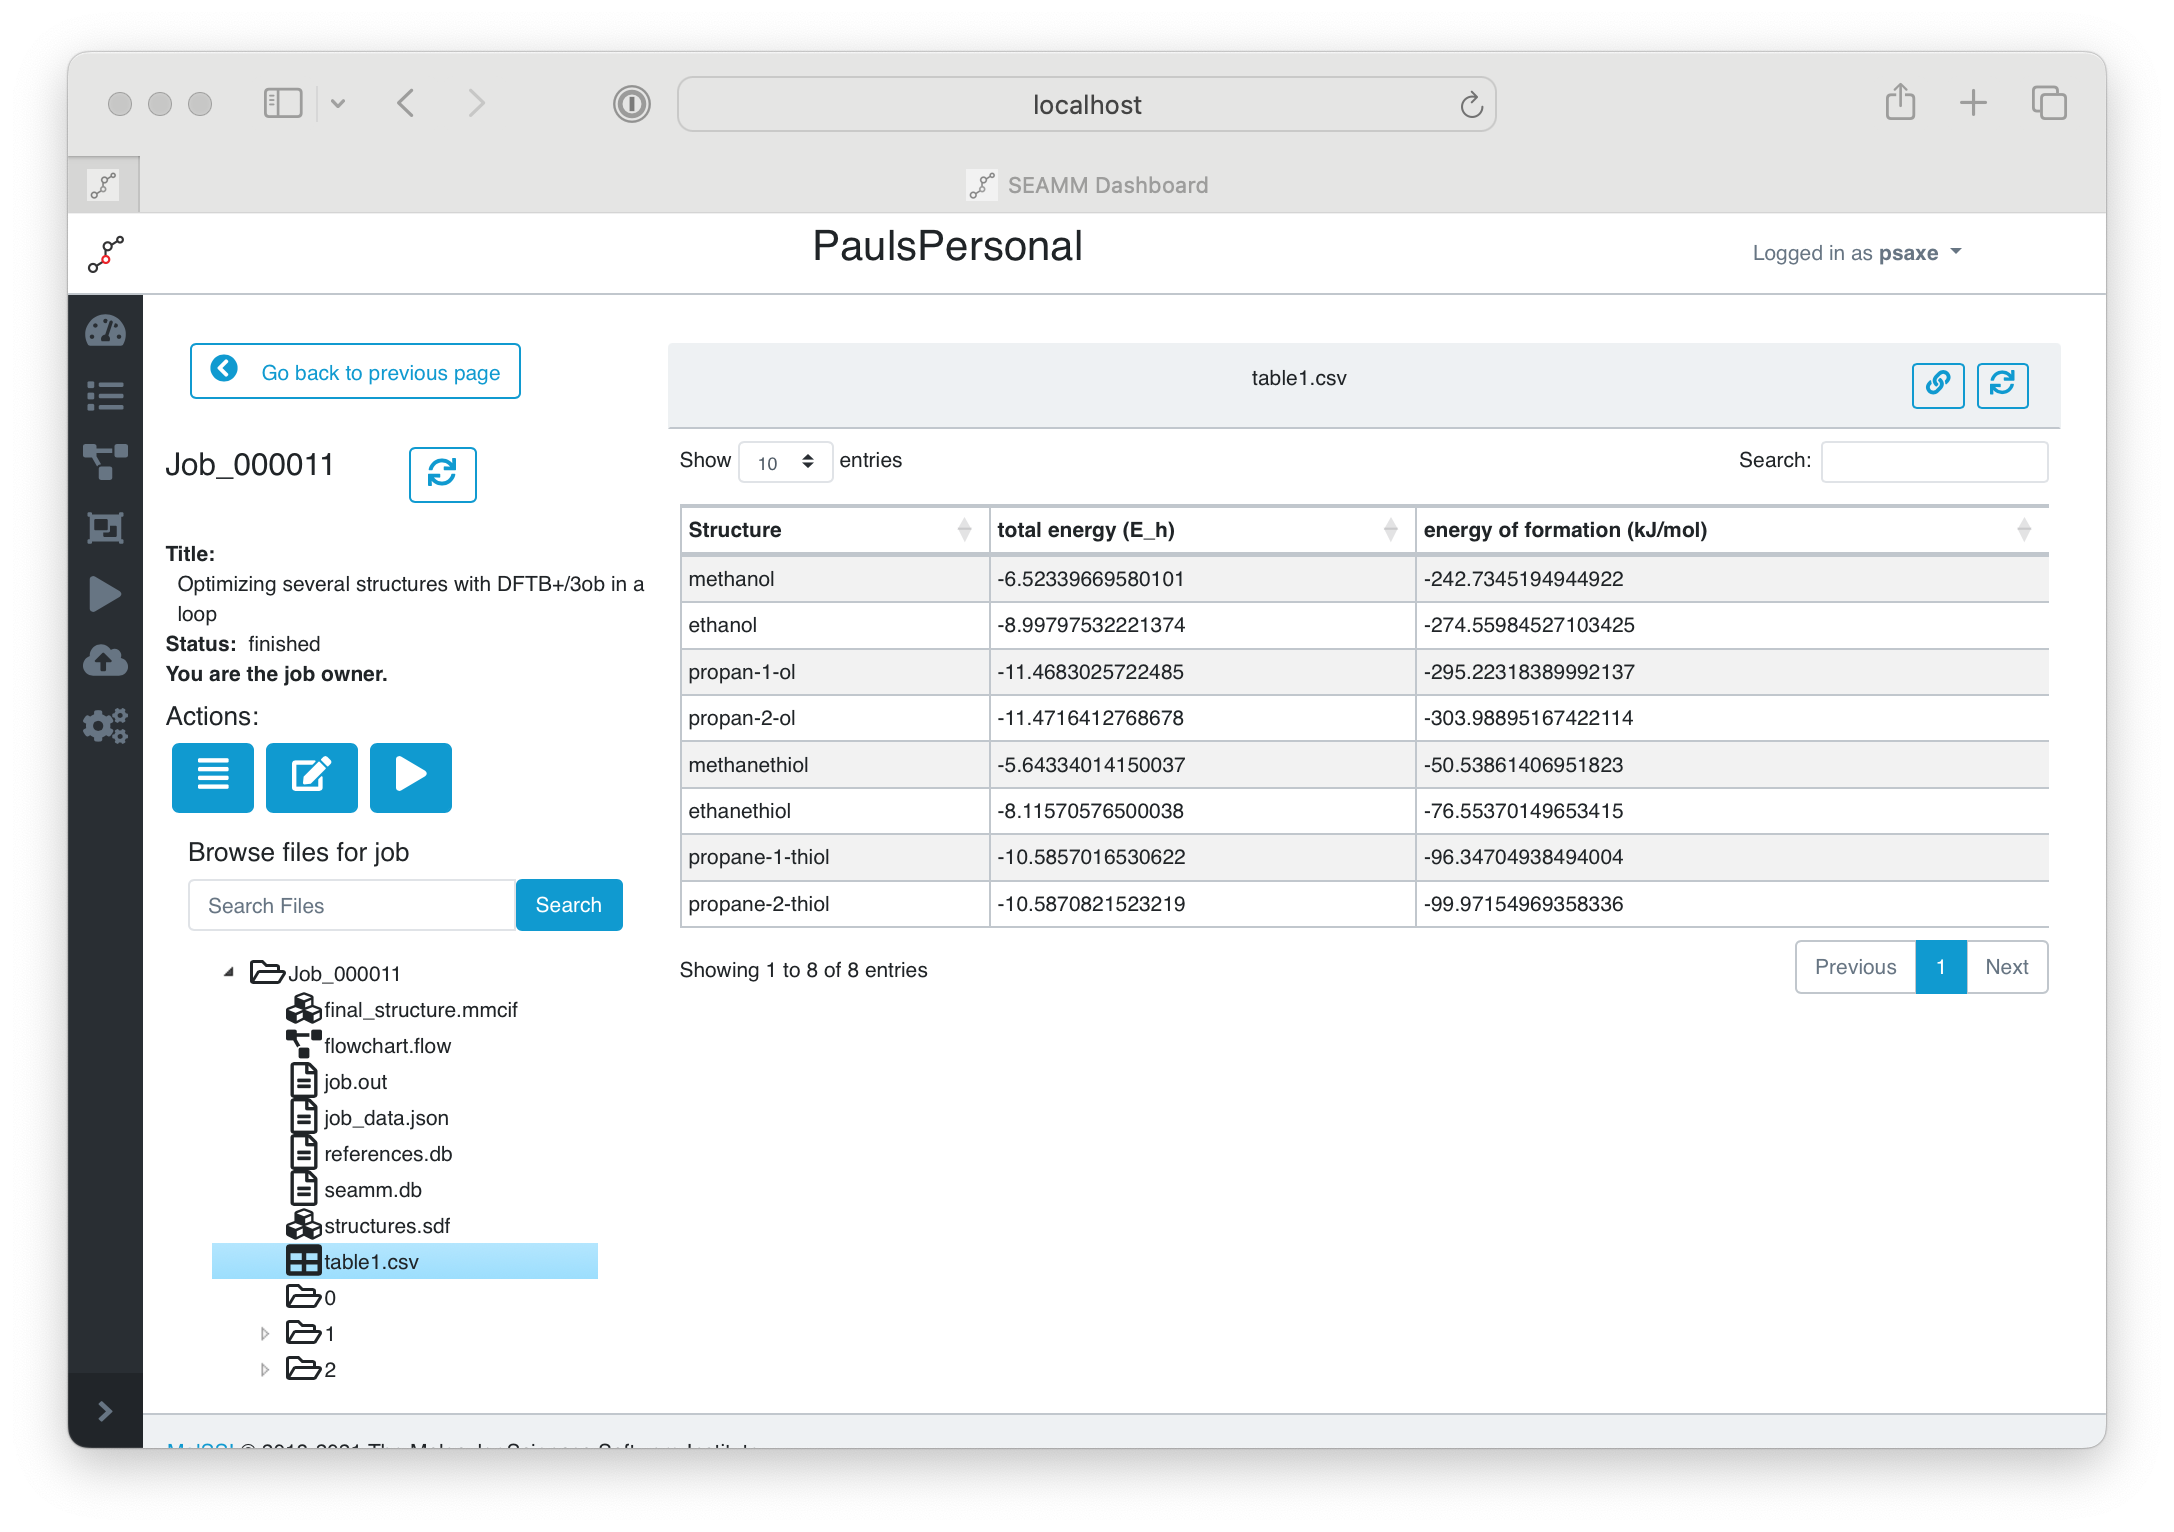
Submitting the job#
You can see the table in the right-hand panel, with the IUPAC names, the total energy in Hartrees and the energy of formation in kJ/mol. You can right-click on the file in the left pane and download it to your machine, where it can be opened in Excel or other spreadsheet program, or read using Python. A CSV file is a common file format tha many codes can read.
We also printed the table in job.out:
Step 5: Table  2023.10.30
      Print table 'table1'

            Structure  total energy (E_h)  energy of formation (kJ/mol)
             methanol           -6.523397                   -242.734519
              ethanol           -8.997975                   -274.559845
          propan-1-ol          -11.468303                   -295.223184
          propan-2-ol          -11.471641                   -303.988952
         methanethiol           -5.643340                    -50.538614
          ethanethiol           -8.115706                    -76.553701
      propane-1-thiol          -10.585702                    -96.347049
      propane-2-thiol          -10.587082                    -99.971550
Note
Most quantum codes calculate a total energy that is the energy of the nuclei and electrons, i.e. the energy it would take to separate the nuclei and electron infinitely far from each other. The details may differ due to core potentials, parameterizations, etc. but that is the gist. It is a large energy, which is hidden by using Hartrees, since 1 Hartree = 2625.5 kJ/mol.
The DFTB+ plug-in has a database of the calculated energy of the elements in their standard state – H2, O2, graphite, … – with some of the parameter sets. It uses these to calculate the “energy of formation”, which is very much like the more normal “enthalpy of formation” except that it does not have the translation, rotational, and vibrational terms that are in the enthalpy. It is the electronic energy of formation. We can calculate the enthalpy, but it is more work; however, the energy of formation is a start and easier to understand than the large electronic energies the code calculates.
For comparison, the enthalpies of formation from the NIST Webbook are:
      Structure    enthalpy of formation (kJ/mol)
       methanol                      -205.
        ethanol                      -234.
    propan-1-ol                      -256.
    propan-2-ol                      -272.3
   methanethiol                       -22.8
    ethanethiol                       -46.15
propane-1-thiol                       -68.58
propane-2-thiol                       -76.94
Remembering that we are comparing energies to enthalpies, and that DFTB is a fast, approximate method, the results look quite reasonable. The trends are correct and energy differences are quite good.
Viewing the Final Structures#
The last step of the flowchart wrote all of the structures to the file structures.sdf. You can easily view them in the Dashboard. Click on structures.sdf in the list of files:
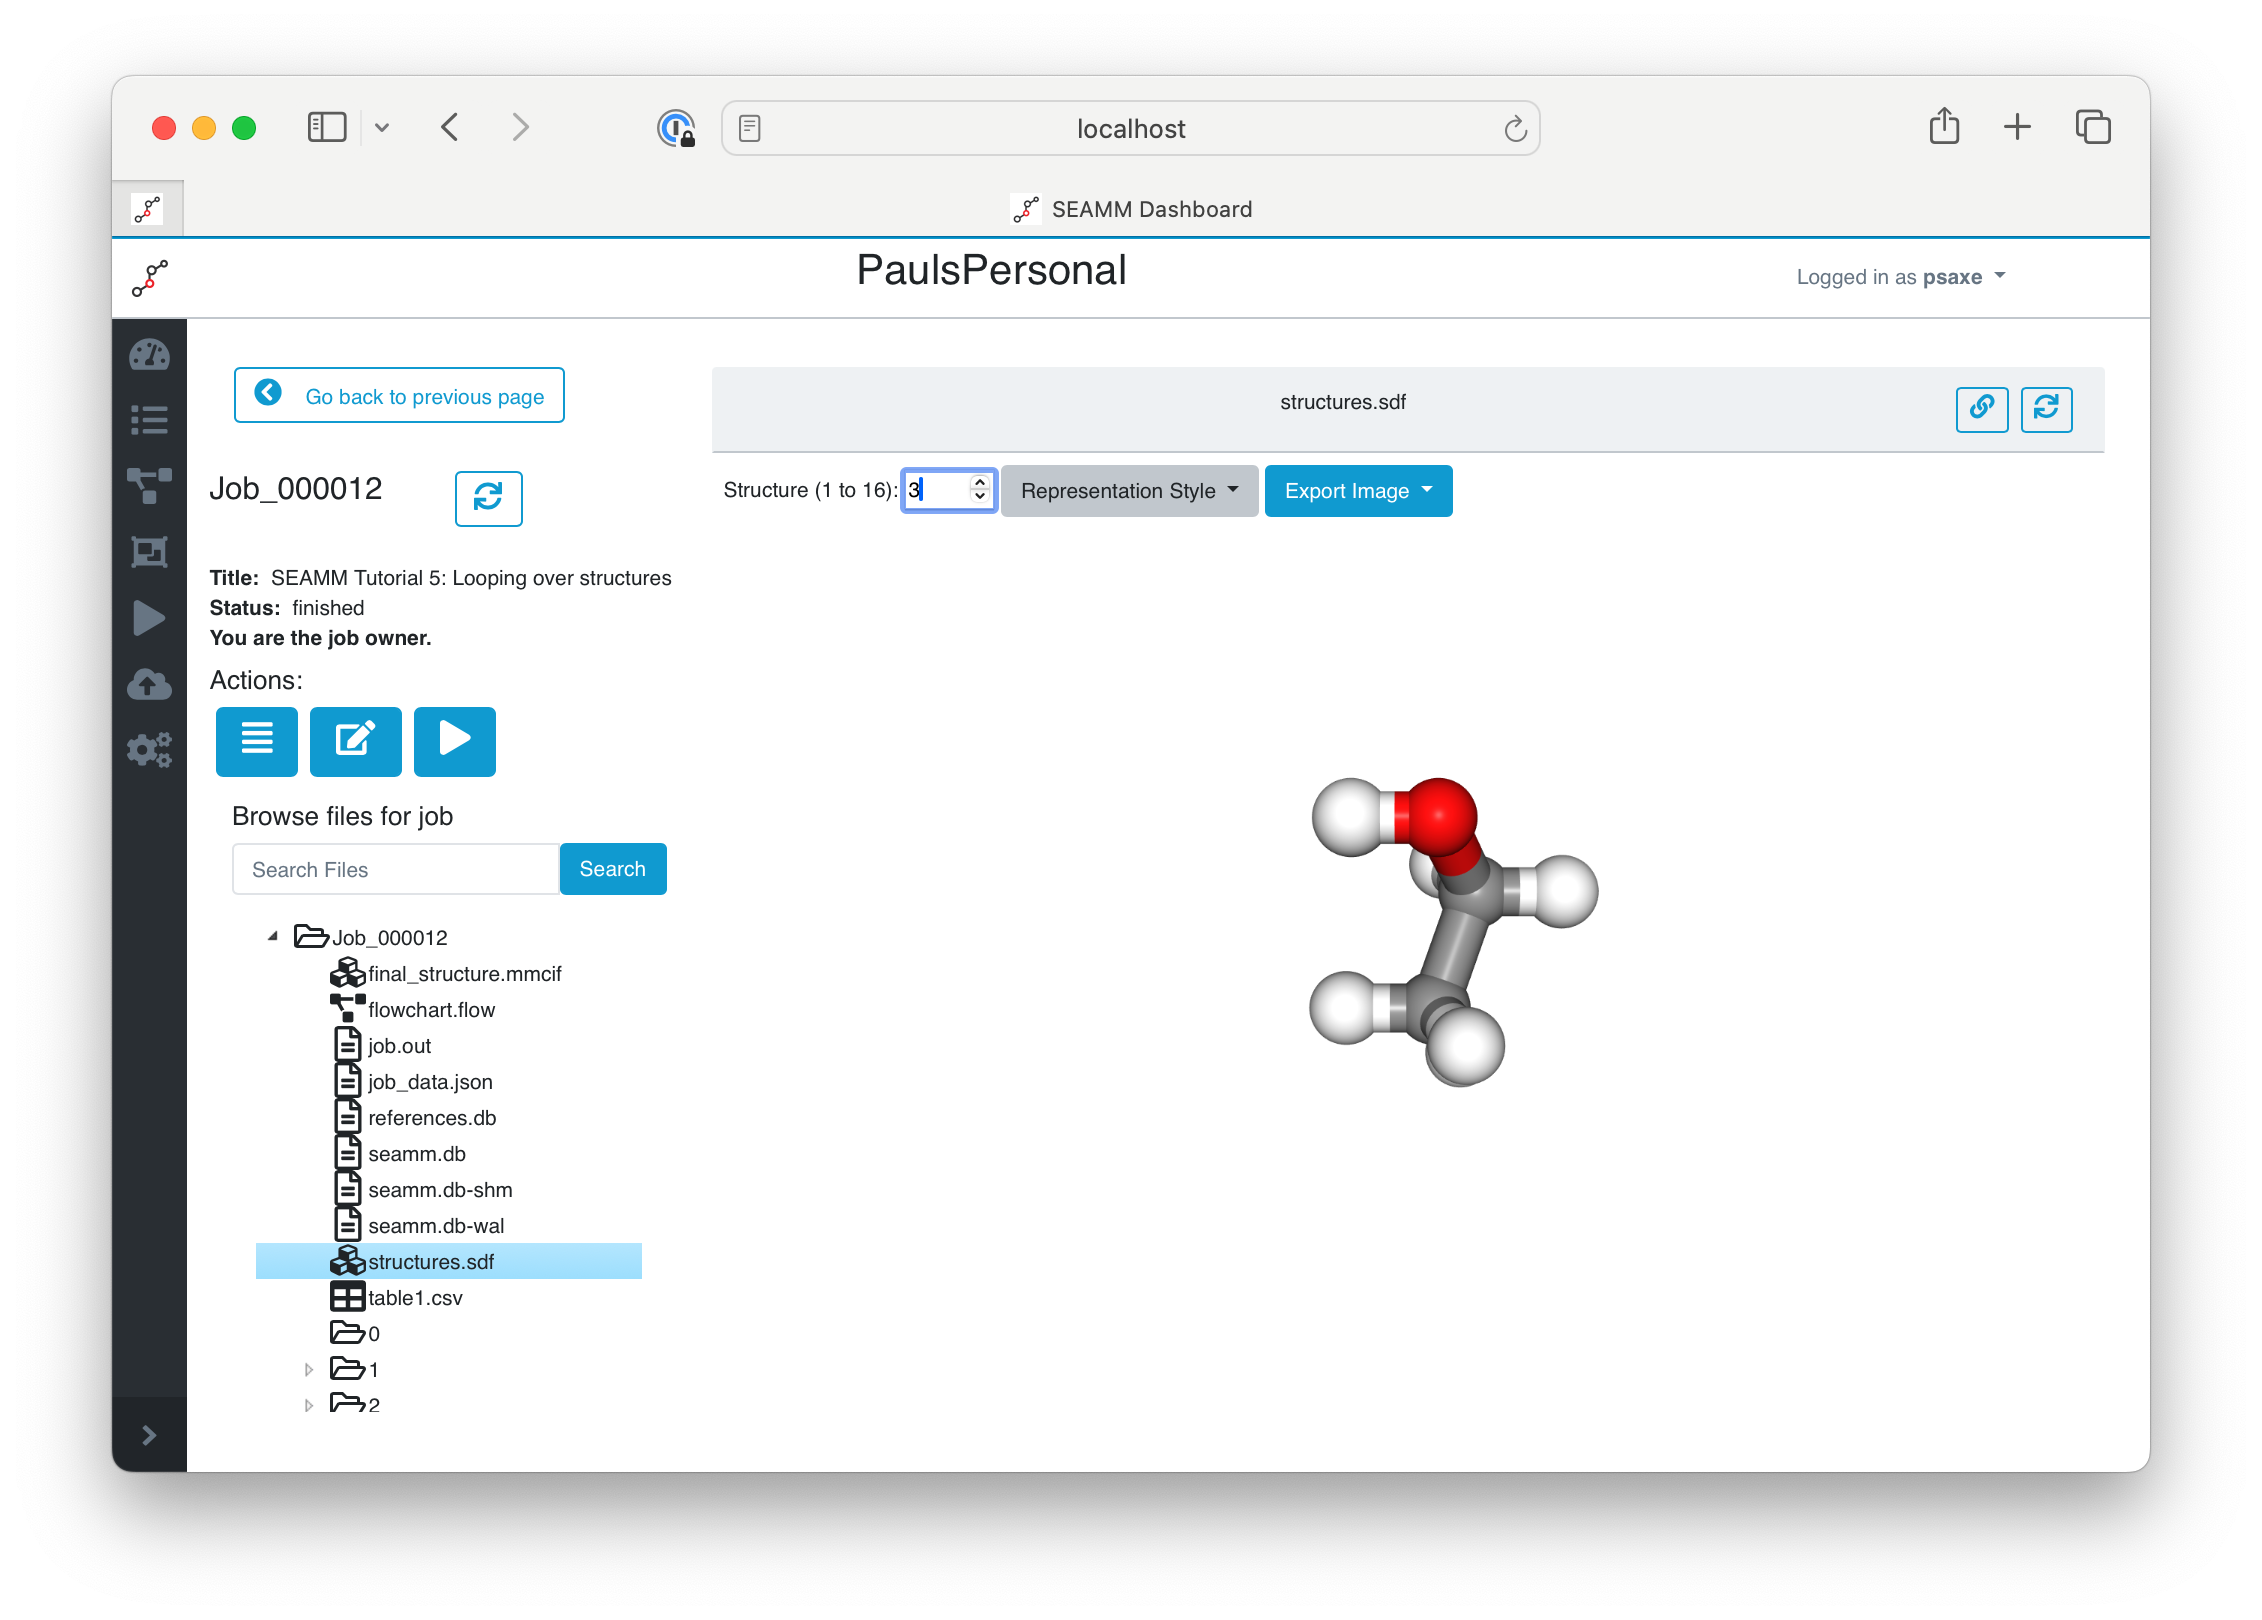
Viewing the Final Structures in the Dashboard#
Some file formats, such as the SDF file we used, support multiple structures in a file. If there is more than one structure, the Dashboard adds a comment at the top of the window with the number of structures, plus an entry for selecting them. You can either type in a structure number (between 1 and 16 in this example) or use the up and down arrows to move through them. We have 16 structures even though we only ran 8 compounds becasue we stored the initial structure from SMILES as well as the optimized structure from DFTB+ in separate configurations. If you click through them with the up arrow you will see pairs of structures, with small changes between the first initial structure and the second optimized structure in each pair.
If you want to know a bit more, download the structure file and examine the contents:
SEAMM=methanol/initial
 OpenBabel11102306473D

  6  5  0  0  0  0  0  0  0  0999 V2000
    0.9340   -0.0572   -0.0486 C   0  0  0  0  0  4  0  0  0  0  0  0
    0.4606   -0.3516   -1.3546 O   0  0  0  0  0  0  0  0  0  0  0  0
    0.5773   -0.7986    0.6356 H   0  0  0  0  0  0  0  0  0  0  0  0
    0.5773    0.9059    0.2513 H   0  0  0  0  0  0  0  0  0  0  0  0
    2.0040   -0.0572   -0.0486 H   0  0  0  0  0  0  0  0  0  0  0  0
    0.7940    0.3412   -1.9940 H   0  0  0  0  0  0  0  0  0  0  0  0
  1  2  1  0  0  0  0
  1  3  1  0  0  0  0
  1  4  1  0  0  0  0
  1  5  1  0  0  0  0
  2  6  1  0  0  0  0
M  RAD  1   1   1
M  END
$$$$
SEAMM=methanol/optimized with DFTB/3ob
 OpenBabel11102306473D

  6  5  0  0  0  0  0  0  0  0999 V2000
    0.9319   -0.0533   -0.0713 C   0  0  0  0  0  4  0  0  0  0  0  0
    0.4617   -0.3478   -1.3615 O   0  0  0  0  0  0  0  0  0  0  0  0
    0.5613   -0.8170    0.6180 H   0  0  0  0  0  0  0  0  0  0  0  0
    0.5780    0.9347    0.2742 H   0  0  0  0  0  0  0  0  0  0  0  0
    2.0360   -0.0497   -0.0324 H   0  0  0  0  0  0  0  0  0  0  0  0
    0.7783    0.3156   -1.9864 H   0  0  0  0  0  0  0  0  0  0  0  0
  1  2  1  0  0  0  0
  1  3  1  0  0  0  0
  1  4  1  0  0  0  0
  1  5  1  0  0  0  0
  2  6  1  0  0  0  0
M  RAD  1   1   1
M  END
>  <Fermi level#DFTB+#DFTB/3ob>
1.3645835502723223

>  <energy of formation#DFTB+#DFTB/3ob>
-2.515766177726602

>  <total energy per formula unit#DFTB+#DFTB/3ob>
-177.5106672880487

>  <total energy#DFTB+#DFTB/3ob>
-177.5106672880487

$$$$
SEAMM=ethanol/initial
...
The first line for each structure is the name. SEAMM uses the system and configuration
names: SEAMM=methanol/initial and SEAMM=methanol/optimized with DFTB/3ob above.
This is followed by the coordinates and bonds. A nice feature of SDF files is that they can contain property data. SEAMM uses this to add the properties
that were requested in the DFTB+ optimization step to the file, labeling them by the
property name, code (DFTB+), and computational model (DFTB/3ob), separated by #:
>  <total energy#DFTB+#DFTB/3ob>
-177.5106672880487
These energies are in eV, which is the natural unit for DFTB+.
Topics Covered#
Looping over input data.
Capturing key results in tables.
A start to understanding the energies produced by DFTB+ and other quantum chemistry codes.
Viewing a set of structures in an SDF file.