

How-To Use a Queueing System Manually#
There are two scenarios where you might want to run SEAMM jobs in a queueing system manually
You want to run calculations on a remote machine where you either can’t or don’t wish to set up a Dashboard,
You want to run on a remote machine using the Dashboard, but at the moment you can’t or haven’t set it up to run through your queueing system automatically.
In either of these cases it is straightforward to install SEAMM and run jobs manually using the queueing system. You can either run them standalone, or have them connect to a Dashboard and Datastore on the machine – probably a front end node – so you can access the results via your browser as normal.
Installing SEAMM#
There is nothing special about installing machine on a remote machine or computing cluster. If it is a single machine, the installation is just like it was on your desktop or laptop. For a larger supercomputer of cluster there is typically one or more head nodes that you log into which share a file system with the compute nodes. You’ll want to install SEAMM on the shared file system so that the compute nodes can access it, but otherwise the installation is just like normal. Just follow the instructions in the Getting Started section of the documentation.
Testing the Installation#
Once you have SEAMM installed on the machine, the simplest way to test that everything
is working is to run a quick flowchart quickmin.flowt
directly for the commandline. Computer centers frown on you running on the front end
nodes, but the following flowchart will take less than a second so there is no
problem. Follow these steps
Make a directory to use for this test, perhaps ~/test, and change to it.
Download the flowchart from the link above, saving it to the new directory.
In a terminal window, make it executable:
chmod +x quickmin.flowExecute it which the SMILES for a molecule as an argument:
./quickmin.flow CCOfor example.You should see output stream past on the terminal, with no error messages.
As long as that worked, you can move on to submitting a batch job to your queueing system. If there was a an error, you’ll need to read the message and understand what went wrong. If it isn’t obvious you can post a message in the SEAMM forum and ask for help. Copy the error message and add it to your note.
Submitting to a Batch Queue Standalone#
First, let’s run the same small test standalone as a batch job using the queueing system. Standalone means that we will run it like an executable, not using the Dashboard or any other part of SEAMM.
Either delete all the files from your test directory or create another test
directory. Download the quick flowchart quickmin.flow to
your test directory and make it executable, and also download this batch file
standalone.job.
The batch file is set up for SLURM:
#!/bin/bash
#SBATCH --job-name=test
#SBATCH --account=personal
#SBATCH --partition=dev_q
#SBATCH --nodes=1 --ntasks-per-node=1
#SBATCH --time=2:00

# You might need to change the working directory, like this, though
# usually the queueing system will use the current directory by default.
# #SBATCH --chdir=/home/psaxe/test

export OMP_NUM_THREADS=1

# This activates Conda in the shell ... change the path, and perhaps the shell used.
eval "$(/projects/chemai/seamm/miniconda3/bin/conda shell.bash hook)"
conda activate seamm

./quickmin.flow --title "Simple QuickMin test calculation" CCO
If you use SLURM, you’ll probably just need to change the account and partition
information and the path for activating Conda. If your computer uses a different
queueing system, you’ll need to edit the script more. Just use an example job file that
works to get the comment lines at the beginning correct. You shouldn’t need to change
anything else except the path for activating Conda. Now submit the job. For SLURM you
use sbatch:
sbatch standalone.job
When the batch job finishes, the directory should have the output files for the run:
(seamm) ls -l
total 400
drwxrwxr-x 2 psaxe psaxe      0 May  1 14:26 0
drwxrwxr-x 2 psaxe psaxe    512 May  1 14:26 1
drwxrwxr-x 2 psaxe psaxe    512 May  1 14:26 2
drwxrwxr-x 2 psaxe psaxe   1024 May  1 14:26 3
-rw-rw-r-- 1 psaxe psaxe    611 May  1 14:33 dashboard.job
-rw-rw-r-- 1 psaxe psaxe   1262 May  1 14:26 final_structure.mmcif
-rwxr-xr-- 1 psaxe psaxe   7378 May  1 14:24 flowchart.flow
-rw-rw-r-- 1 psaxe psaxe   3920 May  1 14:26 job_data.json
-rw-rw-r-- 1 psaxe psaxe   4583 May  1 14:26 job.out
-rwxr-xr-- 1 psaxe psaxe   7378 May  1 14:24 quickmin.flow
-rw-r--r-- 1 psaxe psaxe  57344 May  1 14:26 references.db
-rw-r--r-- 1 psaxe psaxe 258048 May  1 14:26 seamm.db
-rw-rw-r-- 1 psaxe psaxe   4611 May  1 14:26 slurm-1461881.out
-rw-rw-r-- 1 psaxe psaxe    594 May  1 14:32 standalone.job
SLURM directs the standard output (stdout) to the file slurm-xxxxxxx.out by
default. The contents of job.out are almost identical, so you can look at either
file. If you have a different queueing system, the stdout filename will be different,
but should be easy to find.
Check the output file to make sure the job ran. If it did, you are now ready to run standalone. You’ll need to make the flowcharts on a machine with the SEAMM GUI running, like your laptop or desktop, copy the flowcharts and any needed structure files, etc. to the remote machine, tweak the job file, and submit the job.
This approach is not ideal, but is very general and will almost always work. You can either get the information you need from the output files, or copy the files back to you local machine and import them into the Dashboard for viewing locally. How to do that will be covered in another How-To.
Running and Adding the Job to the Dashboard#
If you can run the Dashboard on the remote machine and access its web-server, you can run the jobs in the queue and ask them to automatically insert themselves into the Datastore, where they can be viewd using a browser and the Dashboard.
First, get the Dashboard running on the remote machine. It is possible that you can
install it as a service using the SEAMM installer, but many computer centers are
configured not to allow users to run services on the login nodes. If so, you have two
options. The easiest approach is to log into the front-end node, activate the seamm
conda environment and run the dashboard interactively:
(base) conda activate seamm
(seamm) seamm-dashboard
dashboard:INFO:Logging to the console at level INFO.
dashboard:INFO:Logging to /home/psaxe/SEAMM/logs/dashboard.log at level WARNING.
dashboard:INFO:
dashboard:INFO:Where options are set:
dashboard:INFO:------------------------------------------------------------
dashboard:INFO:root                default         ~/SEAMM
...
The disadvantage is that the Dashboard will stop running as soon as you close that
window. You can get around this using nohup and putting it in the background:
(seamm) nohup seamm-dashboard >& dashboard.log &
[1] 175118
(seamm)
This redirected the output to the file dashboard.log, and using nohup (which is
short for “no hang-up” from the old days of using telephone modems) plus putting the job
in the background (the final “&”) lets the Dashboard run even when you close the window
and log off the machine. It uses almost no resources, some memory and almost no cpu
time, so leaving it running is not usually an issue; however, many computer centers will
not allow commands to run for more than a few hours and then will automatically kill
them, so you may need to start the Dashboard again later.
By default the Dashboard runs on port 55055, so if you can access that port on the
machine, you can access the dashboard through your browser at http://<name or
ip>:55055. It is worth a try! However, if that doesn’t work, you can use ssh to
tunnel to the machine:
ssh -L 55955:localhost:55055 <machine>
The argument to -L is a bit confusing, but here is the explanation. The last part,
localhost:55055 is the computer and port to access on the remote machine that you are
accessing. localhost is the local machine (at the remote site) itself, so this will
forward the Dashboard’s port, 55055, on that machine to the port given at the
beginning of the argument, 55955 in this case. Once you ssh to the remote machine you
can access the remote Dashboard at http://localhost:55955. Note that the local port number is different, with a 9 in
the middle. This allows you to access a local Dashboard at http://localhost:55055 as well as the remote one, with no conflict. If they used the
same port number it would cause problems.
If that gets tiring to type, you can set it up in ~/.ssh/config like this:
Host tinkercliffs
  Hostname tinkercliffs2.arc.vt.edu
  LocalForward 55955 localhost:55055
Almost there! Once you can access the Dashboard with your browser, you are ready to run
on the remote machine and see the results in the Dashboard. Well, almost! You can use
the default project, but it is a good idea to setting up a project for testing so that
you don’t clutter the lists of jobs. In your browser go to the remote dashboard and on
the front page, click on the projects at the top right of the window. You need to click
on the actual words My Projects, not just the box around them.
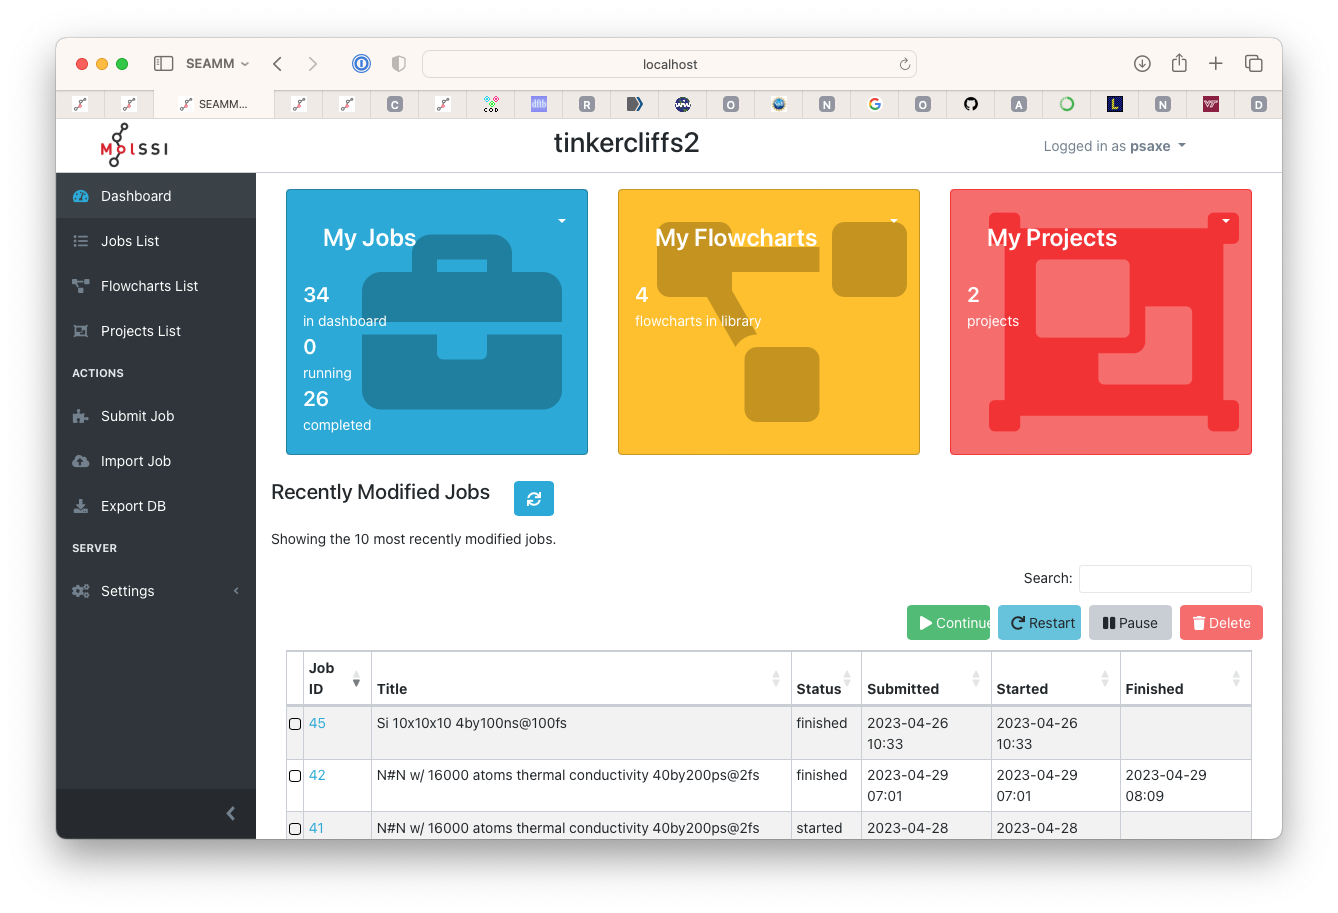
The main Dashboard page#
Now click on the green button Create New Project
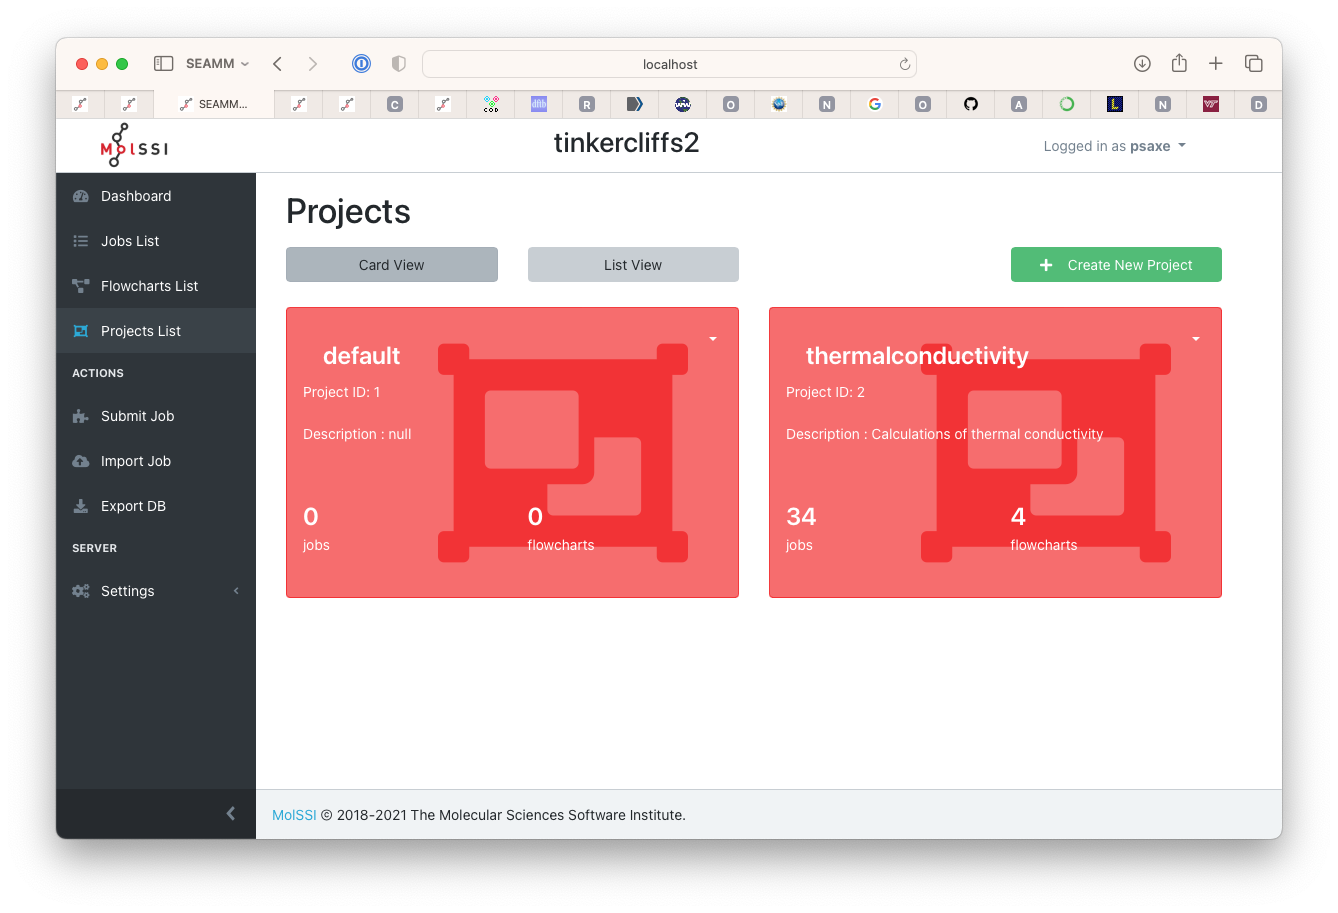
The projects page#
Fill out the name and a decription of the new project. I used testing for the name
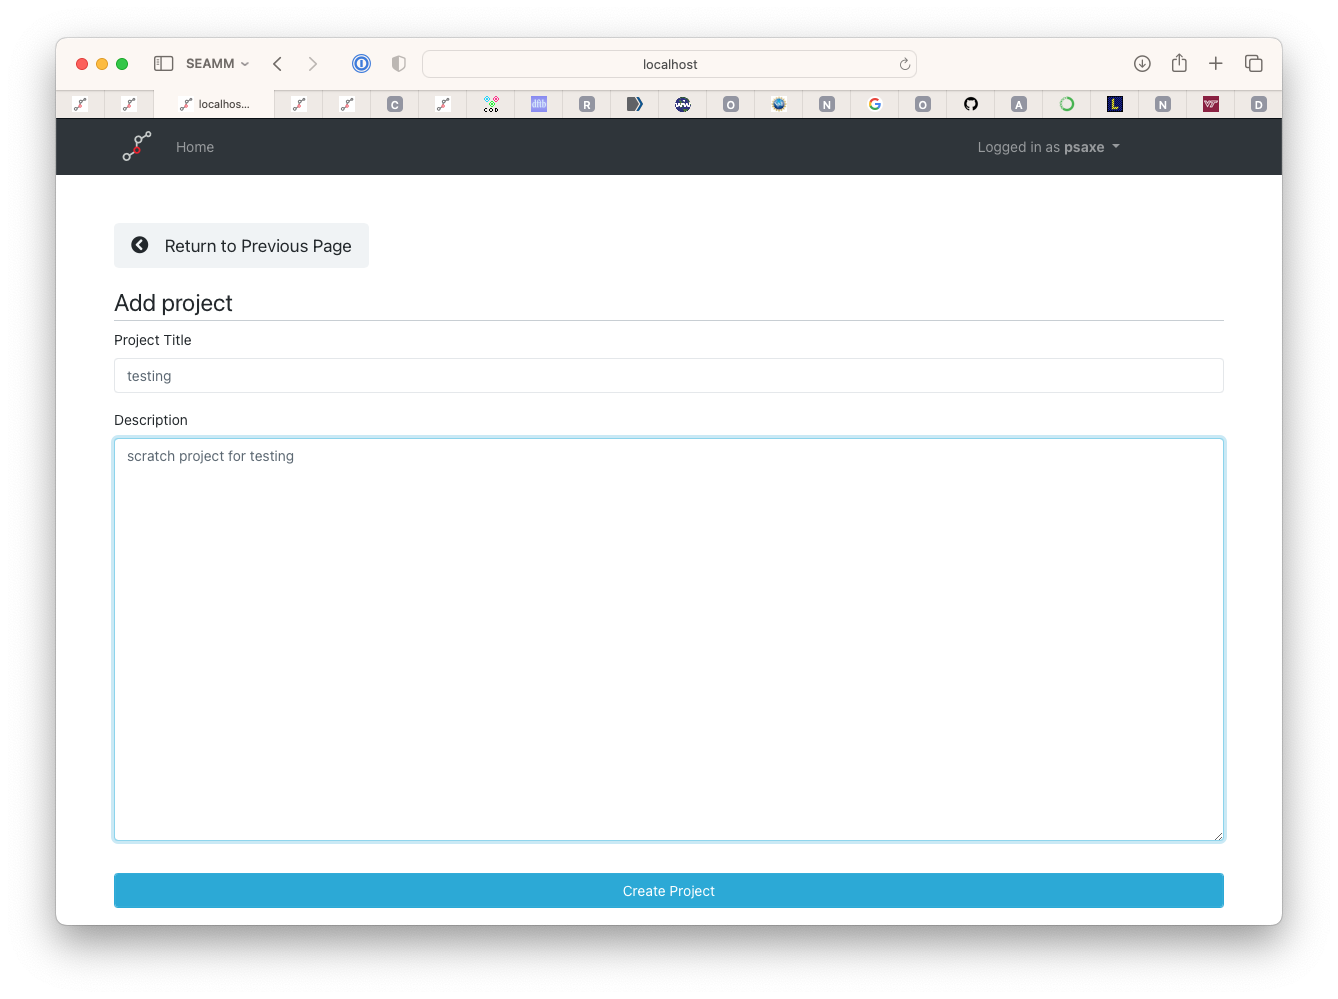
Adding a project#
You will also need your credentials for the Dashboard stored in the file
~/.seammrc. It is simple, just name and password. Mine looks like this:
[Dashboard: localhost]
user = psaxe
password = default
You’ll need to change the name and password.
Finally! Now you are ready to run the test job. Download the batch file for a
dashboard job dashboard.job. You will need to edit it as
you did the previous one. Note this line:
./quickmin.flow --project testing --title "Simple QuickMin test calculation" CCO
The --project options tells the Dashboard which project to use for the job. When you
submit the job this time using sbatch dashboard.job or the appropriate command for
your machine, the output files will no longer go in the current directory. The SLURM
output file slurm_xxxxxxxx.out will, but all the other files will appear in the
Dashboard.
Go back to your browser and go to the project that you create by clicking on its link. Once you job starts running you should see it
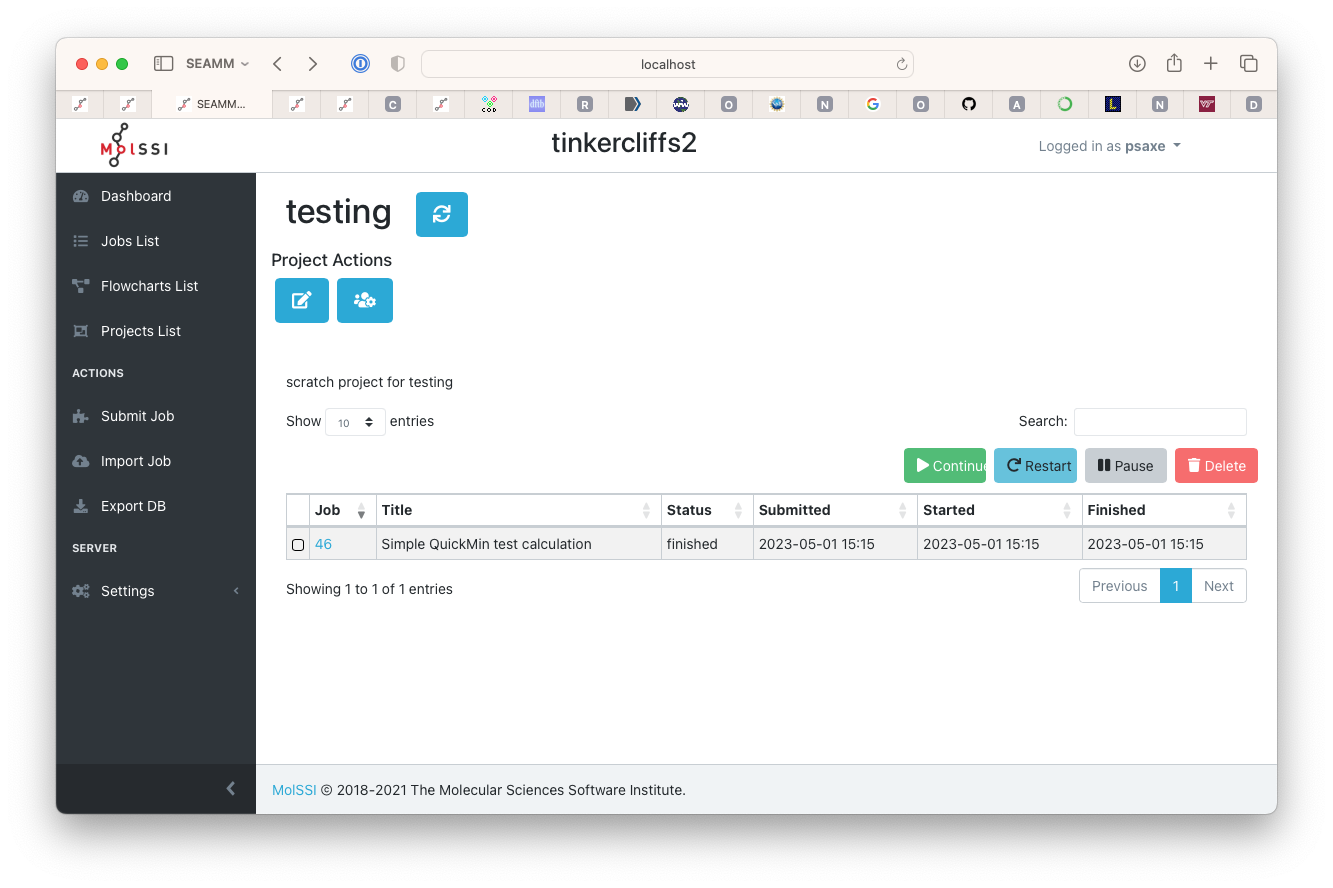
List of jobs in the project#
As normal, clicking on the job number will take you to the detail page where you can see the sructure and other outputs.
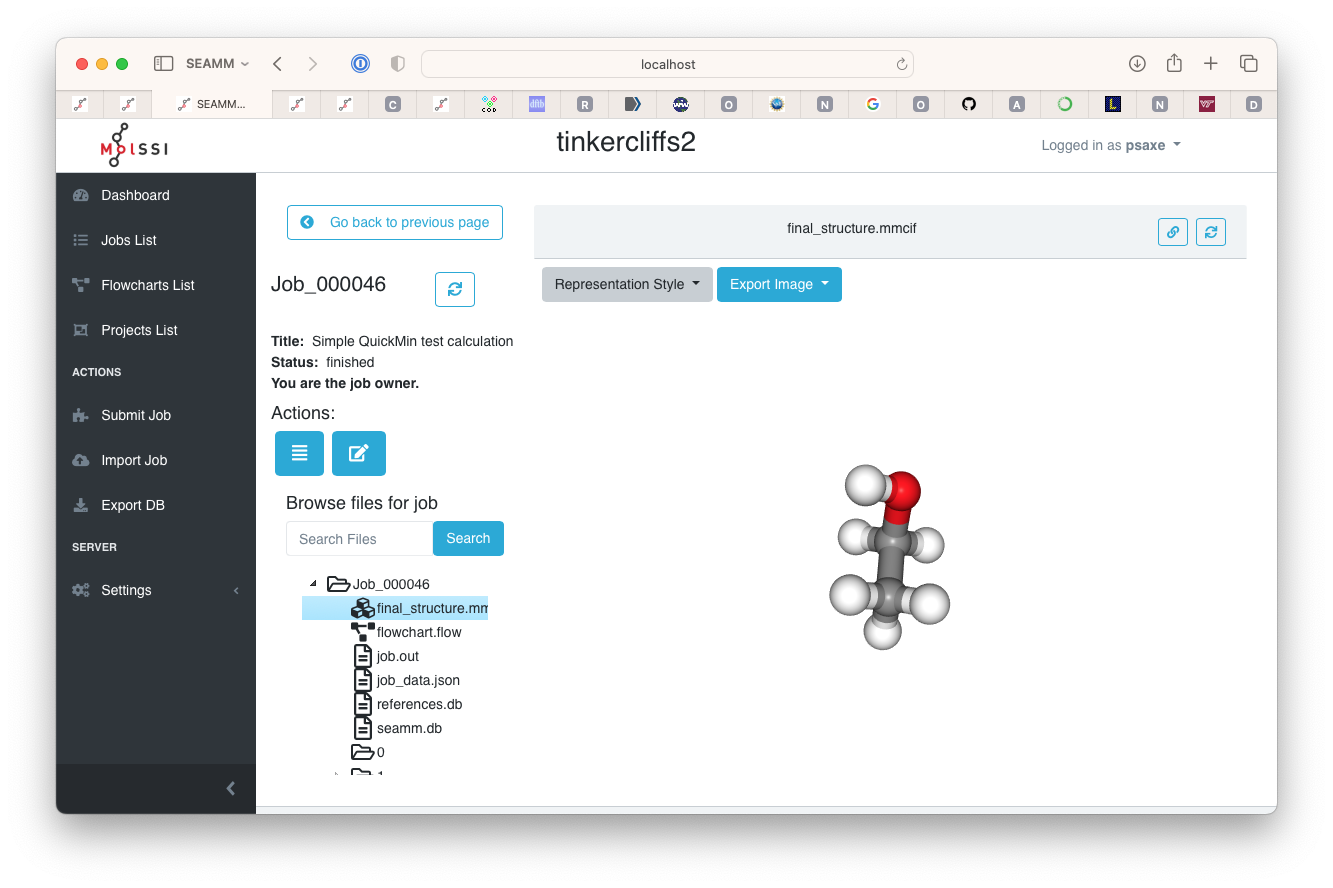
The test job#
Hopefully everything worked. If not, the SEAMM forum is the place to ask for help. Try and describe your problem simply and carefully so that others can help you. Otherwise, you should be able to make flowcharts, copy them to the remote machine, submit them to the queue, and see them in the Dahsboard.
Start working! And have fun!